

Fibonacci Retracement: 5 Proven Entry Rules for Traders
Elliott Wave Insight · September 14, 2026 · 15 min read
- Fibonacci retracement levels should be drawn on the most recent, clear impulse leg and confirmed with additional signals before entering a trade.
- The 50% and 61.8% levels, known as the Golden Zone, are the most significant zones for potential reversals, especially when supported by volume or moving averages.
- Using multiple confirmation factors, such as candlestick patterns or volume spikes, greatly increases the reliability of Fibonacci levels as entry triggers.
- Traders should avoid subjective anchor points, overlapping levels, or multiple timeframes, which can lead to false signals and unreliable setups.
- Fibonacci extensions help set profit targets, with the 161.8% level being the typical goal in strong trends, while stops should be placed beyond the next Fibonacci level or using ATR-based buffers.
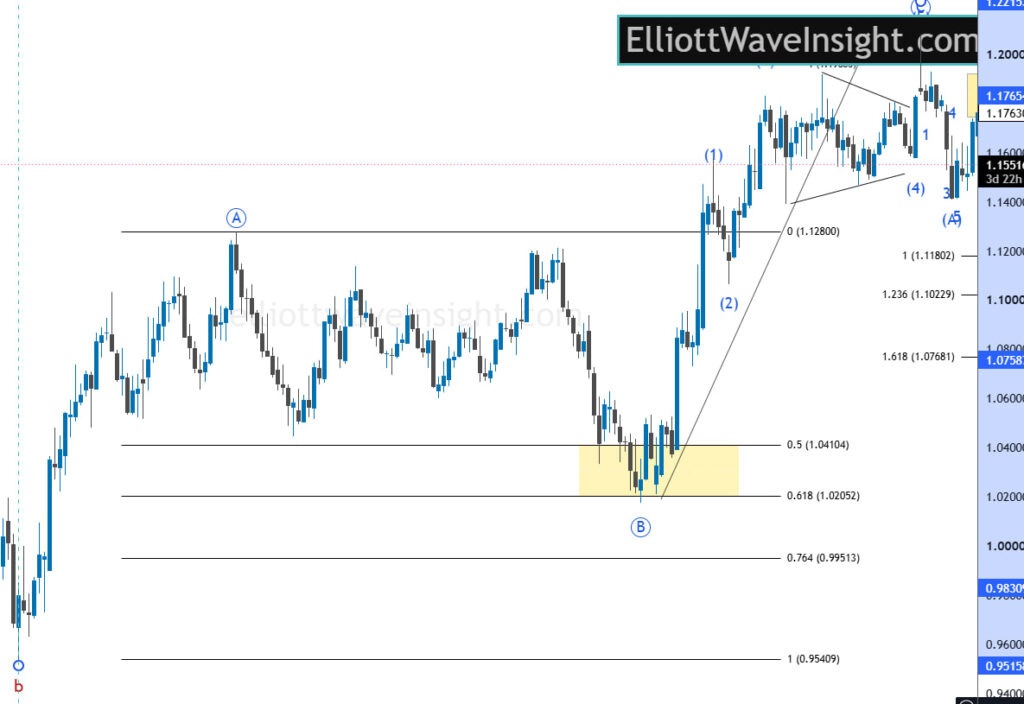
Table of Contents
- What Fibonacci Retracement Levels Are and Why Traders Use Them
- How to Draw Fibonacci Retracement Levels Correctly
- How Traders Use Fibonacci Retracement for Entries
- Using Fibonacci Extensions to Set Profit Targets
- Risk Management, Invalidation Rules, and Stop Placement
- Common Mistakes and the Limits of Fibonacci Retracement
- Chart Walkthroughs: Fibonacci Retracement in Practice
- Elliott Wave Insight Perspective: Integrating Fibonacci With Wave Structure
- An Editorial Take on Fibonacci Discipline
- Applying Fibonacci Setups Inside Elliott Wave Insight’s Trading Tools
- Sources
- FAQ
What Fibonacci Retracement Levels Are and Why Traders Use Them
Fibonacci retracement levels come from a sequence you already know from grade school math: 0, 1, 1, 2, 3, 5, 8, 13, 21, and so on, where each number is the sum of the two before it. Divide most numbers in that sequence by the one two places to the right, and you consistently land near 0.618, the golden ratio. Traders didn’t invent this pattern. They borrowed it from architecture and nature, where the same ratio shows up in nautilus shells and Renaissance paintings, and applied it to price charts because markets, like most things driven by crowd behavior, tend to retrace in proportional chunks rather than random ones.
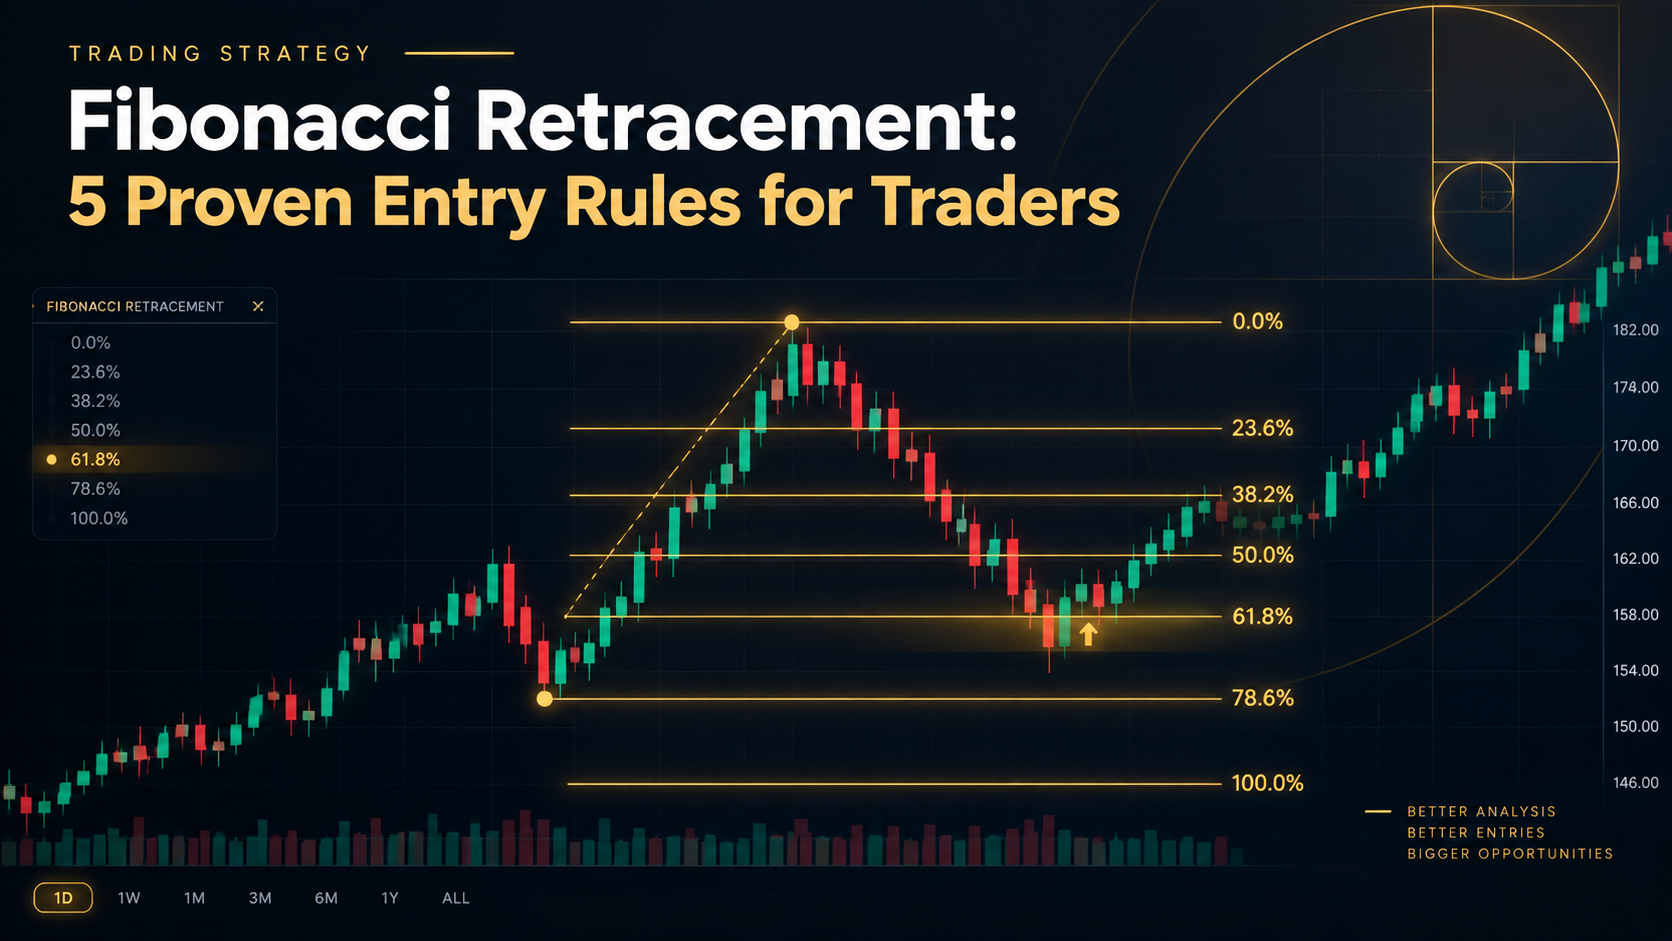
The tool plots those ratios between a swing high and a swing low, creating horizontal lines where price has a statistical tendency to react. According to Wikipedia’s overview of the technique, the most commonly watched levels are 23.6%, 38.2%, 50%, 61.8%, and 78.6%. Here’s what each one typically signals:
- 23.6%. A shallow pullback, common in strong trends where buyers or sellers barely pause before continuing.
- 38.2%. A moderate retracement, often the first real test of trend strength.
- 50%. Not technically a Fibonacci ratio at all, but a widely watched psychological midpoint. Investing notes that traders include it anyway because half-of-the-move behavior shows up so often in practice.
- 61.8%. The golden ratio itself, and historically the deepest level trends tend to hold before losing structure.
- 78.6%. A steep retracement that signals the trend may be in trouble, though it can still hold in volatile assets like crypto or small caps.
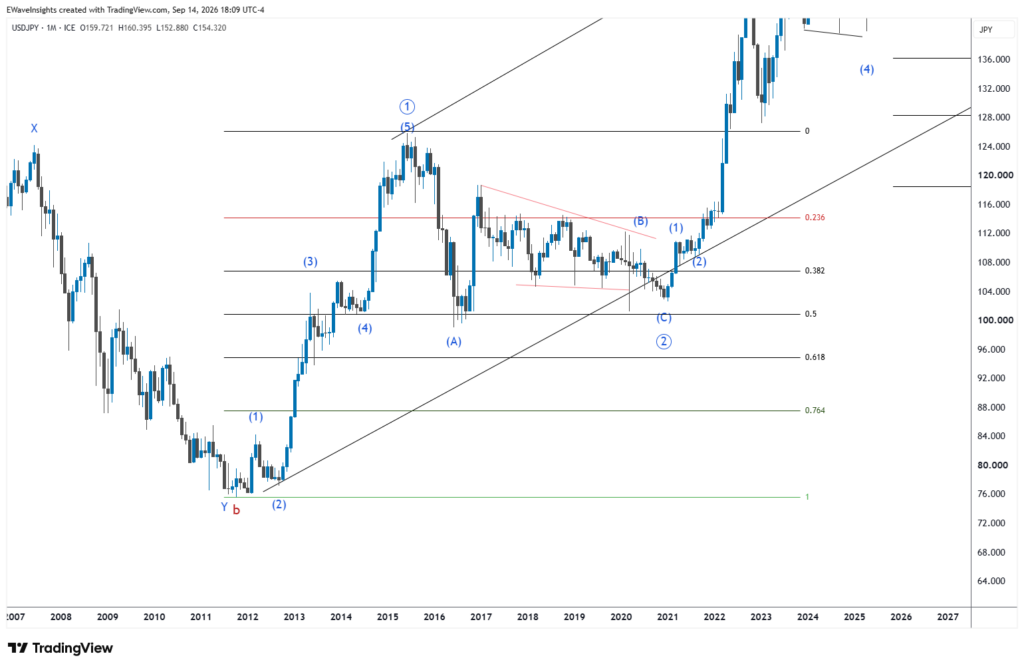
The zone between 50% and 61.8% gets its own name in trading circles: the Golden Zone. Case studies from outlets like FXEmpire repeatedly show this band acting as a high-probability re-entry area when confirmed by price action and volume, which is why it earns more attention than any single line on the chart.
Why do these levels work at all? Partly math, partly psychology. Enough traders, institutions, and algorithms watch the same ratios that the levels become somewhat self-fulfilling. When a large enough crowd expects support at 61.8%, buy orders cluster there, and the level holds because people believed it would. That’s not mysticism. It’s crowd behavior with a mathematical label attached.
How to Draw Fibonacci Retracement Levels Correctly
Bad anchor selection ruins more Fibonacci setups than any other mistake. The tool is only as good as the two points you choose, and getting this step wrong makes every level downstream meaningless.
Start with vocabulary. An impulse leg is a clean, directional price move, the kind of thrust that defines a trend. The swing high and swing low are the extreme points of that leg, the top and bottom of the move you’re measuring. Everything else follows from correctly identifying these three things.
Here’s the process:
- Choose your timeframe first. Decide whether you’re trading off the daily, 4-hour, or 1-hour chart before you touch the drawing tool. Retracements drawn on mismatched timeframes produce conflicting levels that confuse more than they clarify.
- Identify the dominant impulse leg. Look for the most recent clear, uninterrupted move in the direction of the trend, not a minor squiggle inside a larger consolidation. Investing.com’s step-by-step guide makes the point that correct anchor selection is the single biggest driver of a retracement tool’s usefulness.
- Anchor 0% and 100% at the extremes. In an uptrend, click the swing low first (0%) and drag to the swing high (100%), and the tool will then plot pullback zones below the high. In a downtrend, reverse it: anchor 0% at the swing high and 100% at the swing low, projecting levels above the low.
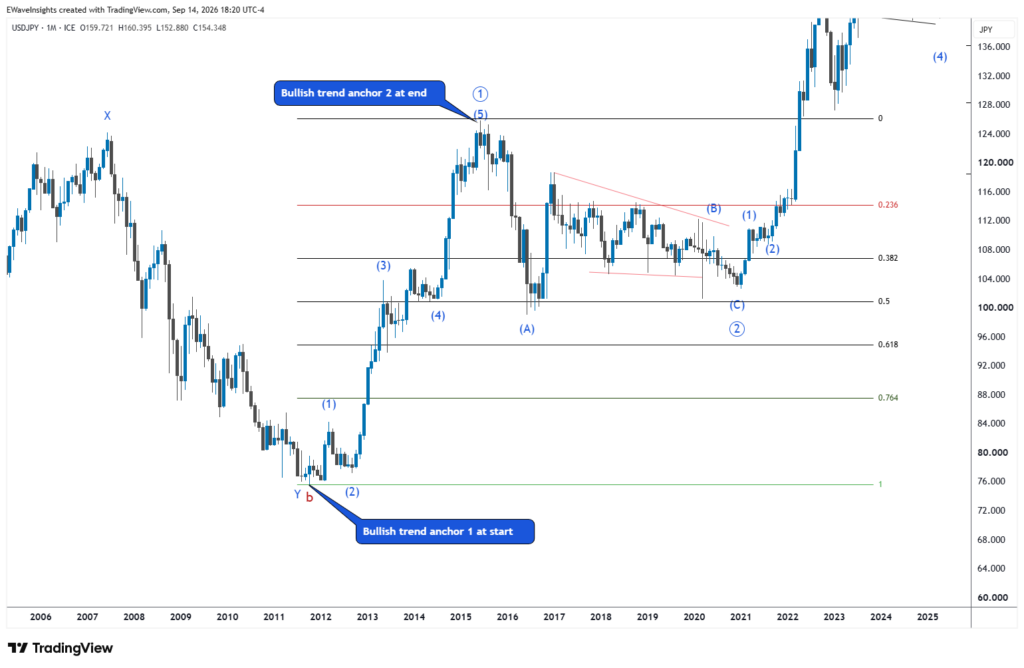
Before you trust the lines you’ve drawn, run through this quick validation checklist:
- Does the impulse leg represent the most recent, most obvious trend move on your chosen timeframe?
- Are you anchoring to the actual extreme wick or candle body, not an arbitrary nearby point?
- Would a second trader looking at the same chart draw the same two anchor points?
- Does the retracement zone line up with any visible prior support or resistance?
Common pitfalls include anchoring to a minor swing inside a larger move, which produces levels too tight to be useful, redrawing the tool repeatedly until the lines “agree” with a bias you already hold, and mixing timeframes, like anchoring off a weekly swing while trading a 15-minute chart.
Pro Tip: Draw your Fibonacci levels once per impulse leg and leave them alone. If you find yourself deleting and redrawing the tool three or four times to make the level “fit” your trade idea, that’s confirmation bias talking, not the chart.
How Traders Use Fibonacci Retracement for Entries
A drawn Fibonacci level is not a trade signal. It’s a zone where you start paying closer attention, and the entries that actually work layer confirmation on top of the level rather than trading the touch itself.
Three entry frameworks cover most of how experienced traders approach this:
Single-entry at the level. Place one order right at the Fibonacci zone and let it fill or don’t. This suits traders who want simplicity and are comfortable missing trades that reverse before reaching their price.
Scaled entries. Split the position across two or three orders through the retracement zone instead of committing it all at once. This reduces the risk of getting caught by a single bad fill and lets you average into a better cost basis if the pullback runs deep.
Confirmation-first entries. Wait entirely for price action to prove the level before committing capital. This is the slowest approach, and also the one with the highest win rate for traders who don’t want to guess.
Whichever framework you use, BabyPips’ Fibonacci retracement guide makes an important point: the tool is predictive only in a probabilistic sense. Price will not always reverse precisely at a Fibonacci line, so waiting for confirmation isn’t optional caution, it’s the difference between a strategy and a guess.
Build your confirmation checklist from these four categories:
- Candlestick patterns. Bullish or bearish engulfing candles, hammers, or pin bars forming right at the level signal rejection in real time.
- Moving averages. A 50 or 200 period moving average sitting near your Fibonacci zone adds a second, independent reason for price to react there.
- Volume spikes. A surge in volume as price touches the level suggests real participation, not a random wick.
- Momentum indicators. RSI showing bullish or bearish divergence at the retracement zone often precedes the actual reversal by a candle or two.
This is where confluence changes the entire risk calculation. Investopedia’s strategy guide for trading Fibonacci retracements notes that confluence, the overlap of a Fibonacci level with a moving average, prior support or resistance, or a trendline, materially increases the reliability of that level as a trigger.
Position sizing should reflect that difference. A single-factor setup, Fibonacci level alone, no other confirmation, warrants a smaller size or a pass entirely. A triple-confluence setup, Fibonacci zone plus moving average plus a volume spike on a rejection candle, justifies your standard size or slightly larger, because the probability of the level holding has genuinely improved.
Pro Tip: Keep a simple tally on your trade journal: how many confirmation factors lined up at entry. Over 20 or 30 trades, you’ll usually see win rate climb in direct proportion to confluence count, which turns a vague feeling into a number you can actually act on.
Using Fibonacci Extensions to Set Profit Targets
Retracements tell you where price might pause on the way back. Extensions tell you where it might go once the pullback is over, and they’re the more objective half of a Fibonacci-based trade plan.
Plotting an extension requires three points instead of two: the start of the impulse move, the end of that move, and the pullback low or high where price reversed.
OANDA’s guide to retracements and extensions frames these levels as the natural complement to retracements: retracements find entries, extensions find exits. Here’s how each level tends to get used:
- 127.2%. A conservative first target, useful for partial profit-taking in weaker trends or choppy conditions.
- 138.2%. A middle-ground target, less common than 127.2% or 161.8% but useful when the first target clears easily and momentum is still building.
- 161.8%. The most-watched extension level and the default target for swing trades in a healthy trend.
- 200% and beyond. Reserved for unusually strong trends, often in momentum-driven assets, where 161.8% gets blown through without hesitation.
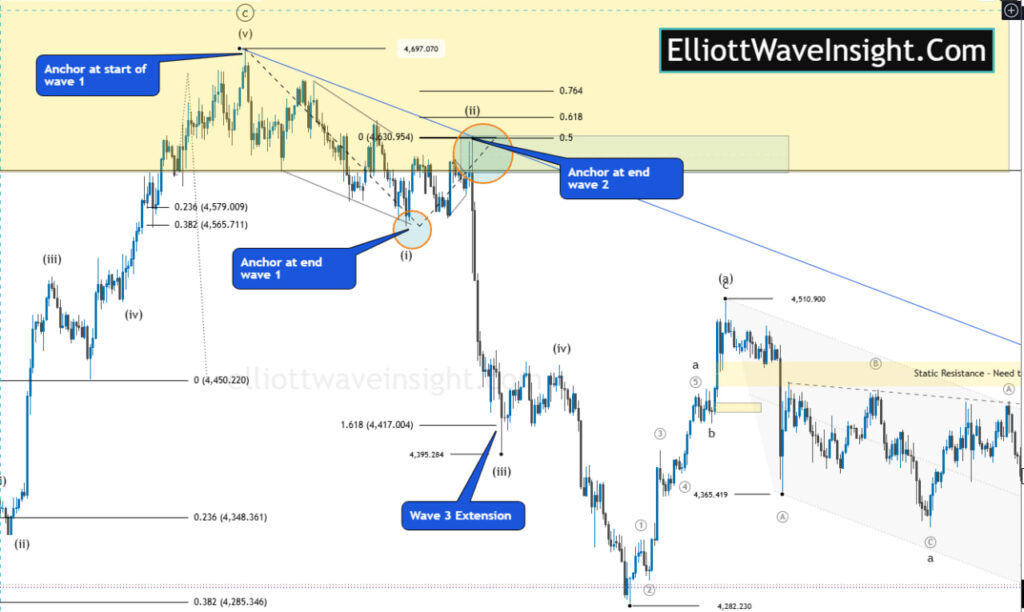
Different traders lean on different extension levels depending on trend strength and risk appetite. A common approach is to scale out at each extension level as price reaches it rather than picking one exit. This locks in profit progressively without forcing you to guess the exact top or bottom of the move.
Risk Management, Invalidation Rules, and Stop Placement
Every Fibonacci-based trade needs a hard rule for when the idea is simply wrong, and that rule should exist before you enter, not after price starts moving against you.
Wikipedia’s entry on Fibonacci retracement frames these levels as zones of interest rather than exact prices, and that framing cuts both ways.
For stop placement, two heuristics cover most situations:
- Beyond the next Fibonacci level. If you entered at 61.8%, a stop just past 78.6% or beyond the 100% swing point gives the trade room to breathe without exposing you to unlimited risk.
- ATR-based buffer. Using the Average True Range to set a stop distance adapts automatically to how volatile the asset currently is, which matters more in crypto and small-cap stocks than in a slow-moving major forex pair.
Position sizing should tie directly to your risk-to-reward ratio and chosen extension target.
Confluence matters here too. Investopedia’s guide to Fibonacci strategy points out that pairing retracement levels with trendlines, moving averages, or RSI reduces subjectivity and false signals, the two things that quietly erode a trader’s edge over time. Fewer false signals means fewer stopped-out trades, which means your risk management plan actually performs the way you modeled it.
Common Mistakes and the Limits of Fibonacci Retracement
Fibonacci retracement fails most often because of the trader, not the tool. Subjective anchor selection is the biggest culprit: two traders looking at the identical chart can draw meaningfully different levels depending on which swing they pick, and that subjectivity opens the door to confirmation bias, where you unconsciously choose anchors that support a trade you already wanted to take.
The tool also breaks down in choppy, non-trending markets. Fibonacci retracement works best in trending conditions, according to OANDA’s technical analysis education, and sideways price action produces false signals because there’s no clean impulse leg to anchor against in the first place. In a range-bound market, switch to support and resistance zones or a range-trading approach instead of forcing a retracement tool onto a trend that doesn’t exist.
Chart clutter compounds both problems. Traders who draw retracements from every visible swing, then add extensions, pivot points, and five moving averages on top, end up with so many overlapping lines that literally any price level can be justified as significant. Simplification fixes this:
- Draw retracements only from the single most obvious, most recent impulse leg.
- Limit your confirmation tools to two or three, not six or seven.
- If a level isn’t backed by at least one other form of confluence, treat it as noise rather than signal.
Chart Walkthroughs: Fibonacci Retracement in Practice
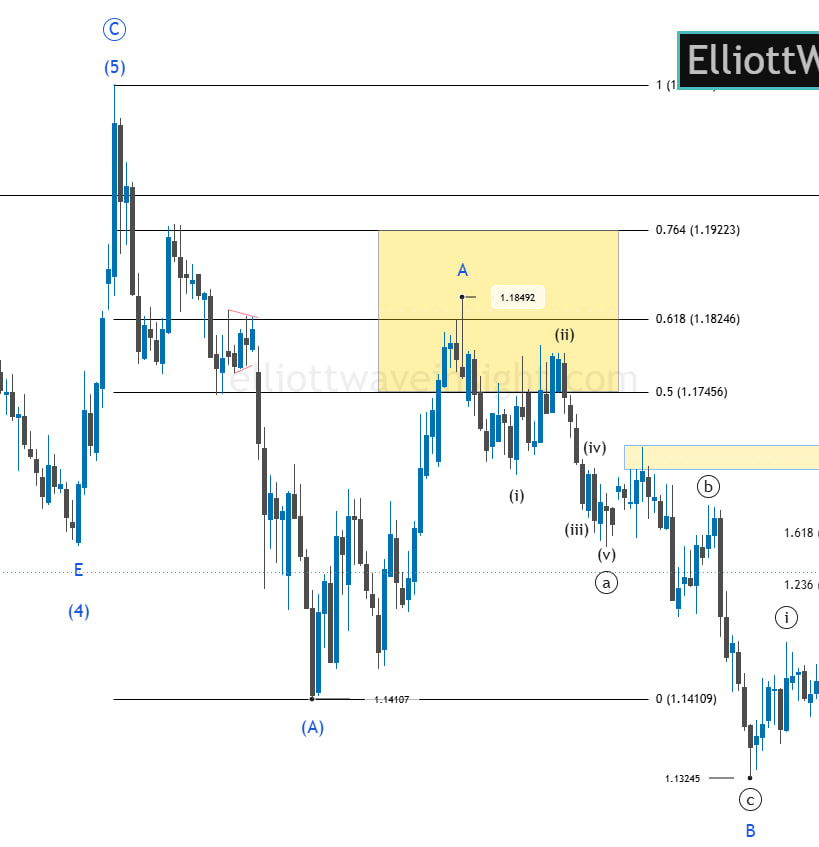
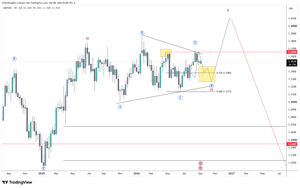
Example 1: A live EURUSD retracement into the Golden Zone. After the prior advance, price pulls back into the 0.5 to 0.618 retracement zone, tagging 1.18492 before the count resumes. The Golden Zone isn’t just a percentage band here, it lines up with the wave structure itself, which is exactly the kind of confluence this article’s Elliott Wave section covers in more depth.
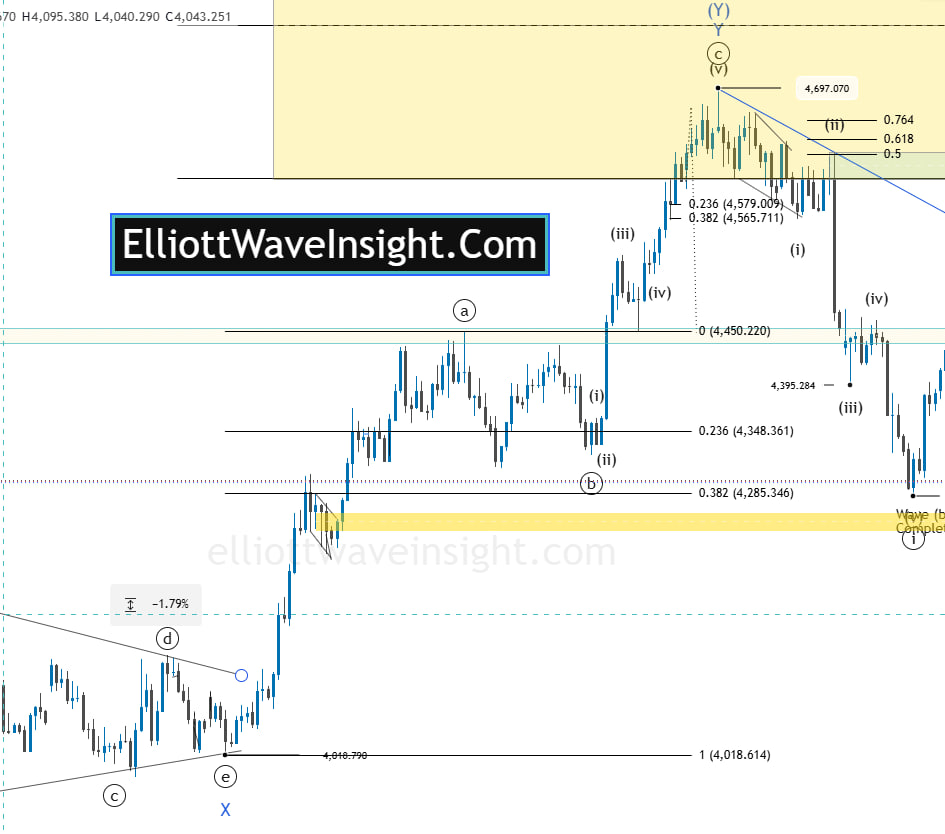
Example 2: A gold shallow retracement in a strong impulse. After wave (i) completes, price pulls back to only the 0.382 level rather than the deeper Golden Zone, a shallow retracement typical of a trend that isn’t done moving. Wave (iii) then extends sharply higher, and wave (iv) produces another shallow pullback near the highs before the move completes.
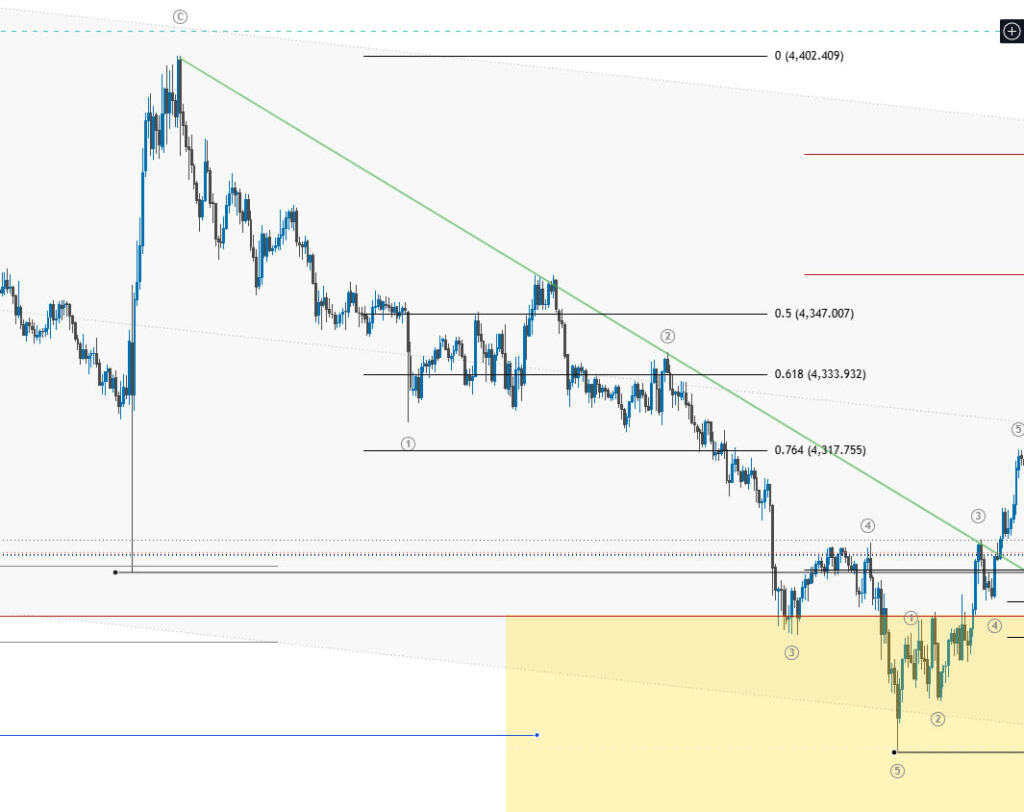
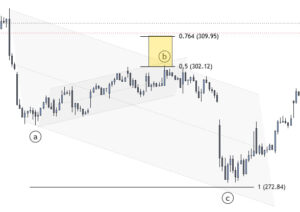
Example 3: A failed reversal at the Golden Zone. Price declines into the 0.5 to 0.618 zone and forms a small basing attempt, but the bounce fails to make a new high, a sign the level didn’t hold with real conviction. Rather than force a long against a reversal that never confirmed, the disciplined read is to stand aside until price actually proves the zone holds.
Elliott Wave Insight Perspective: Integrating Fibonacci With Wave Structure
Fibonacci retracement gets far more precise once you know which wave you’re actually measuring, and this is the piece most retail guides skip entirely. Elliott Wave analysis identifies the underlying market structure, impulse waves, corrective waves, diagonals, before you ever touch the Fibonacci tool, which solves the anchor selection problem at its root. Instead of guessing which swing qualifies as “the” impulse leg, a wave count tells you explicitly: anchor to Wave 1 through Wave 3, or to Wave A through Wave C, depending on the structure in play.
Wave targets and Fibonacci extensions tend to converge in a way that single-tool traders never see. When your extension target and your wave count target land at the same price, you’ve found genuine confluence, not the coincidental kind that comes from stacking unrelated indicators.
Elliott Wave Insight’s daily research is built around this overlap, tracking wave counts across Forex, stocks, crypto, and gold so traders aren’t drawing Fibonacci levels in a structural vacuum. The resources that support this workflow include:
- Daily wave counts across 30+ markets, updated with the impulse and corrective structure already mapped out.
- MT5 Expert Advisors that apply structured trade plans with built-in risk management.
- The Elliott Wave Academy, a multi-module educational hub covering wave identification and anchor selection in depth.
- Worked examples like the EURUSD Wave (E) setup and the Bitcoin Cycle Wave IV triangle roadmap, showing how wave counts and Fibonacci levels interact across timeframes.
An Editorial Take on Fibonacci Discipline
Most traders don’t fail at Fibonacci retracement because the tool doesn’t work. They fail because they treat a probabilistic zone like a guaranteed price and skip the confirmation step that makes the whole approach honest. The traders who do well with this tool are boring about it: same anchor rules every time, same confirmation checklist, same invalidation point, trade after trade.
Before your next setup, run through this:
- Anchor to the clearest impulse leg on your chosen timeframe.
- Wait for at least one confirmation signal inside the retracement zone.
- Check for confluence with a moving average, trendline, or prior support/resistance.
- Set your stop beyond the 100% swing point, not inside it.
- Plan your extension target before you enter, not after price starts moving.
Anthony
Applying Fibonacci Setups Inside Elliott Wave Insight’s Trading Tools
Drawing a clean Fibonacci retracement is only half the job. Knowing which swing to anchor to, and having that anchor confirmed by an actual wave structure, is what separates a repeatable setup from a guess dressed up in percentages. Elliott Wave Insight builds its daily research around exactly that gap, pairing wave counts across Forex, stocks, crypto, and gold with the Fibonacci confluence points traders already rely on.
Elliott Wave Insight provides daily wave counts across multiple markets, live market intelligence with real-time key levels, integrated MT5 Expert Advisors for automated trade execution, an automated trade journal for tracking equity and performance, and structured, self-paced Elliott Wave education. Instead of manually second-guessing which swing high or swing low deserves your Fibonacci anchor, you get a wave count that’s already done that work, with extension targets that often line up with the very Fibonacci levels this article covers. If you want to see how wave structure and Fibonacci confluence work together on live charts, start with Elliott Wave Insight’s daily analysis and check today’s setups against your own watchlist.
Sources
FAQ
How Do I Use Fibonacci Retracement in Trading? Identify a clear impulse leg, anchor the tool from swing low to swing high (or the reverse in a downtrend), then wait for a confirmation signal, like a candlestick reversal, volume spike, or moving average overlap, inside a retracement zone before entering.
Do Fibonacci Retracements Actually Work? They work in a probabilistic sense in trending markets, meaning price reacts at these levels often enough to be useful, but BabyPips notes they don’t guarantee a reversal, which is why confirmation matters more than the level itself.
Is the 50% Retracement a Fibonacci Level? No. The 50% level isn’t derived from the Fibonacci sequence, but Investing.com explains traders include it anyway because it acts as a widely watched psychological midpoint that price often respects.
Do Professional Traders Use Fibonacci? Yes, though typically as one layer of confluence rather than a standalone signal. Professional and institutional traders commonly pair Fibonacci levels with moving averages, trendlines, or wave structure, an approach services like Elliott Wave Insight build directly into their daily analysis.
What Is the Golden Zone in Fibonacci Trading? The Golden Zone is the price band between the 50% and 61.8% retracement levels, an area case studies from outlets like FXEmpire repeatedly flag as a high-probability re-entry zone when confirmed by price action and volume.

Join the discussion