

ABC Correction: The Complete Guide to Elliott Wave Corrective Patterns
An ABC correction is the most fundamental corrective structure in Elliott Wave Theory. Whenever a market finishes an impulsive move, whether that’s a small five-wave rally on a 1-hour chart or a multi-year bull run, the market doesn’t simply reverse in a straight line. Instead, it typically retraces in three distinct legs labelled A, B, and C.
Every abc correction pattern falls into one of two main families: the zigzag and the flat correction. Both share the same A-B-C labelling, but their internal structure, Fibonacci targets, and market implications are very different. Understanding which one you’re looking at is essential for anyone using Elliott Wave analysis to time entries, set stop losses, or anticipate where a pullback is likely to end.
In this guide, we’ll break down what an abc correction is, how to tell a zigzag apart from a flat correction, the rules that govern a valid abc correction pattern, how Fibonacci levels help forecast where it will end, and what typically happens in an abc correction after wave 5.
What Is an ABC Correction?
An abc correction is a three-wave corrective structure that moves against the direction of the preceding trend. Ralph Nelson Elliott identified this pattern as the market’s natural way of correcting an impulsive move before the next trending phase begins.
The three legs are:
- Wave A — the initial move against the prior trend.
- Wave B — a partial or deep retracement of wave A, moving back in the direction of the original trend.
- Wave C — the final leg, which completes the correction and is typically followed by trend resumption.
The internal structure of waves A, B, and C is what determines which type of abc correction wave you’re dealing with, and this is where the zigzag and the flat correction diverge sharply.
Zigzag vs Flat Correction: The Two Core ABC Patterns
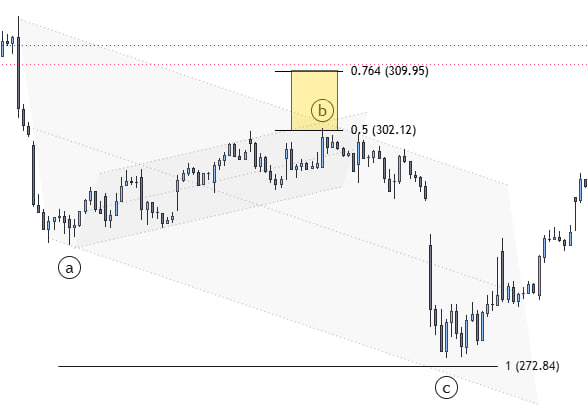
| Feature | Zigzag | Flat Correction |
|---|---|---|
| Wave A structure | 5-wave impulse | 3-wave corrective |
| Wave B retrace | 50–79.6% of Wave A | 90–125%+ of Wave A |
| Wave C structure | 5-wave impulse | 5-wave impulse |
| Overall shape | Sharp, angled “Z” shape | Sideways, range-bound |
| Typical position | Wave 2, 4, or B | Wave 2, 4, B, or X |
| Market signal | Corrective pullback against trend | Strong underlying trend continuing |
For the full breakdown of rules, Fibonacci ratios, trade setups, and real chart examples, see our dedicated guides:
- Zigzag Correction: Rules, Guidelines & Trading Applications
- Flat Correction: Regular, Expanded & Running Patterns
ABC Correction Rules: The Quick Version
Every abc correction pattern, whether zigzag or flat, must satisfy a set of structural rules before it can be labelled with confidence. These abc correction rules are what separate a valid Elliott Wave count from wishful labelling.
- Check Wave A’s internal structure first. Five sub-waves points to a zigzag. Three sub-waves points to a flat.
- Measure Wave B’s retracement of Wave A. A shallow 50–79.6% retrace confirms a zigzag. A deep 90% or greater retrace confirms a flat, and beyond 105% signals an expanded flat.
- Wave C must move in the same direction as Wave A, extending the overall correction rather than reversing it, and should itself be a five-wave impulse in both pattern types.
- An abc correction after wave 5 must fully retrace within the price territory of the prior impulse and cannot be confused with the start of a new impulsive trend in the opposite direction until wave C is complete and confirmed.
- Don’t force a label. If Wave B retraces more than 79.6% but Wave A only shows three waves, you are looking at a flat, not an aggressive zigzag. If Wave A shows five waves but Wave B retraces less than 50%, reassess before assuming a standard zigzag.
ABC Correction Fibonacci Levels
Fibonacci retracement and extension levels are the standard tool for projecting where an abc correction is likely to end, but the abc correction fib levels you should use depend entirely on which pattern type you’ve identified.
Zigzag Fibonacci Targets
- Wave B commonly retraces 50–79.6% of Wave A, with 61.8% the most frequent.
- Wave C often equals the length of Wave A (a 1.0 extension), or extends to 123.6–161.8% of Wave A.
Full detail, including frequency statistics for each ratio and a live XAUUSD example, is covered in our zigzag correction guide.
Flat Correction Fibonacci Targets
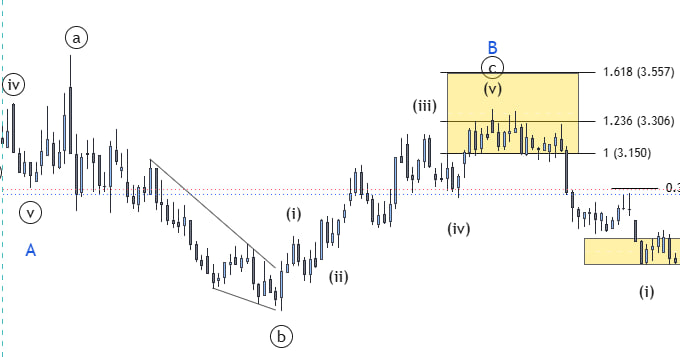
- Wave B retraces 90–100% of Wave A in a regular flat, 105–125% in an expanded flat, and beyond 125% in a rare running flat.
- Wave C typically reaches the 1.236–1.618 extension of Wave A, with 1.618 the most common primary target.
Full detail, including all three flat sub-types and a live XAUUSD example, is covered in our flat correction guide.
ABC Correction After Wave 5
One of the most practical applications of this pattern is identifying an abc correction after wave 5. Once a five-wave impulse completes, whether that’s wave 5 of a smaller degree or the final wave of a larger Elliott Wave cycle, the market almost always needs to correct that advance before the next impulsive phase begins.
This is where distinguishing between a zigzag and a flat becomes critical for trade planning:
- If the correction after wave 5 forms as a zigzag, expect a sharp, fast retracement of 50–79.6% before the next impulsive move begins, often signalling the trend is still intact but taking a decisive breather.
- If it forms as a flat, particularly an expanded flat, expect a slower, sideways retracement that retraces deep into Wave A territory before Wave C completes. This pattern is often a sign of a very strong underlying trend that will resume with force once the flat completes.
- Confirming that wave C has completed, ideally with momentum divergence or a clear five-wave sub-structure, gives traders a higher-confidence entry point in the direction of the original trend.
Common Mistakes When Labelling an ABC Correction
- Confusing wave B for the start of a new trend. Because wave B moves in the same direction as the original impulse, it’s tempting to assume the trend has resumed. Always wait for wave C to develop before drawing that conclusion.
- Forcing a zigzag label onto what is actually a flat. If wave A only shows three sub-waves rather than five, the structure is a flat, not a zigzag, and the Fibonacci targets change accordingly.
- Using only the 100% Wave A target for Wave C in a flat. Flat corrections most commonly see Wave C reach 1.618 times Wave A, not just an equal move.
- Ignoring the running flat and truncated zigzag possibilities. Both are less common but signal an unusually strong underlying trend once identified correctly.
Final Thoughts
The abc correction is the building block behind nearly every corrective structure in Elliott Wave Theory, from simple pullbacks to complex double and triple three combinations. Learning to distinguish a zigzag from a flat, applying the correct Fibonacci levels for each, and correctly identifying an abc correction after wave 5 will sharpen your wave counts and improve your timing on both entries and exits.
For the complete rules, Fibonacci tables, identification checklists, and live chart examples, explore our full guides on the zigzag correction and the flat correction, or follow our daily Elliott Wave analysis for updated charts and wave counts as these patterns form in real time across gold, indices, and forex pairs.
More Elliott Wave Education
For more Elliott Wave education, pattern breakdowns and market analysis, visit the Elliott Wave Insight YouTube channel .


Join the discussion