

If you are looking for an Elliott Wave course, you have probably already found the problem. There are dozens of them, they all promise the same things, and most of the free material contradicts itself. Half of what circulates online gets the basic rules wrong.
This post covers what separates a good Elliott Wave course from a bad one, the three things most of them skip, and the one I took myself and now recommend.
What you are actually trying to learn
Elliott Wave is not a prediction system. It is a way of describing the shape of price movement.
The core observation is that markets move in recognisable patterns that repeat at every scale. Trending moves subdivide into five waves. Corrections subdivide into three. Those corrections come in a handful of named forms: zigzags, flats, triangles, and combinations of those joined together. A five-wave advance on a one-minute chart has the same structure as one spanning forty years.
That is the whole framework. Everything else is detail about telling one pattern from another and knowing what each implies about what comes next.
The value is not that it gives you targets. It is that it tells you when you are wrong. A valid count comes with rules attached, and when price breaks one of them the count is dead and you know immediately. That is worth more than a price projection.
Three things most Elliott Wave courses skip
Free videos and cheap courses cover impulses well enough. Here is where they run out.
Degree
Every wave sits inside a larger wave and contains smaller ones. Getting the degree wrong is the most common error in the whole framework, and it propagates: label a structure one level too high and everything nested inside it is wrong too.
Most beginners assign degree from the bottom up, which almost guarantees a rebuild when they zoom out. A course worth paying for teaches you to anchor from the largest visible structure and count down, and gives you the typical duration for each degree so you can sanity-check what you have labelled.
The rules are not guidelines
Wave two cannot retrace beyond the start of wave one. Wave three cannot be the shortest of waves one, three and five. Wave four cannot enter wave one’s price territory, unless the structure is a diagonal, in which case it must.
These are hard constraints. A count that breaks one is not a weak count, it is not a count at all. A surprising amount of published wave analysis quietly ignores this, which is why so much of it is unfalsifiable.
Corrections
Impulses are straightforward. Corrections are where most of your chart time goes and where nearly all the mistakes happen.
The difference between a running flat and an expanded flat changes what you expect next. A double three looks like noise until you can see the three separate structures inside it. Triangles appear in specific positions and nowhere else, and knowing which positions is half the value of spotting one.
Any Elliott Wave course that spends most of its time on impulses is teaching you the easy quarter of the subject.
The Elliott Wave course we recommend
I took Mudassar’s Elliott Wave Principle on Udemy myself, and it is the one I point people to.
It runs to roughly 16 hours across 47 lectures, rated 4.6 by more than 7,000 learners. What makes it worth the time is that it covers all three of the gaps above rather than just the first quarter.
On corrections, it works through regular and expanded flats, running flats, contracting and expanding triangles, barrier and running triangles, single, double and triple zigzags, and combinations. Each one gets a real chart example rather than an idealised diagram, which matters because textbook patterns and market patterns look different.
On validity, it covers the rules and labelling conventions, position of patterns, alternation, extension and truncation, channelling and wave equality, and what he calls the right look, which is the judgement about whether a structure is proportioned correctly. That last one is the hardest thing to teach and the thing that separates a count from a guess.
On application, there is a section combining wave counts with RSI, which matters because momentum is one of the few independent checks on whether a fifth wave is genuinely terminal. And there is a live trading sequence taking a NASDAQ position through analysis, entry, trailing stops and exit, which shows the decision-making between having a count and placing a trade.
The course includes downloadable resources and assignments where you label charts yourself. That part is not optional. You do not learn this by watching.
What no Elliott Wave course will do
It will not make you profitable. None of them will, and any course claiming otherwise is selling something other than education.
Wave counting will not tell you what size to trade, how to place a stop relative to your account rather than the chart, or how to stop yourself re-entering a losing idea four times in twenty minutes. Those are separate disciplines and they cost people far more money than bad counts do.
What the framework gives you is a structure for thinking about price, a clear definition of when you are wrong, and market context that is more useful than most alternatives. That is a genuine edge. It is not a complete one, and anyone telling you otherwise is not being straight with you.
Where to go next
Learn the framework first. Then read published analysis with the labels making sense to you instead of washing over you.
If you already know the basics and would rather have the counts than do the work yourself, that is what our membership covers. The free tier gives you summaries and charts as they publish, which is a reasonable way to see whether the approach suits how you think before paying for anything.
Disclosure: Elliott Wave Insight is an affiliate partner. We may earn a commission if you purchase through the link above, at no extra cost to you. Trading involves substantial risk of loss and is not suitable for everyone. Nothing in this post is a recommendation to buy or sell any instrument.
At a Glance
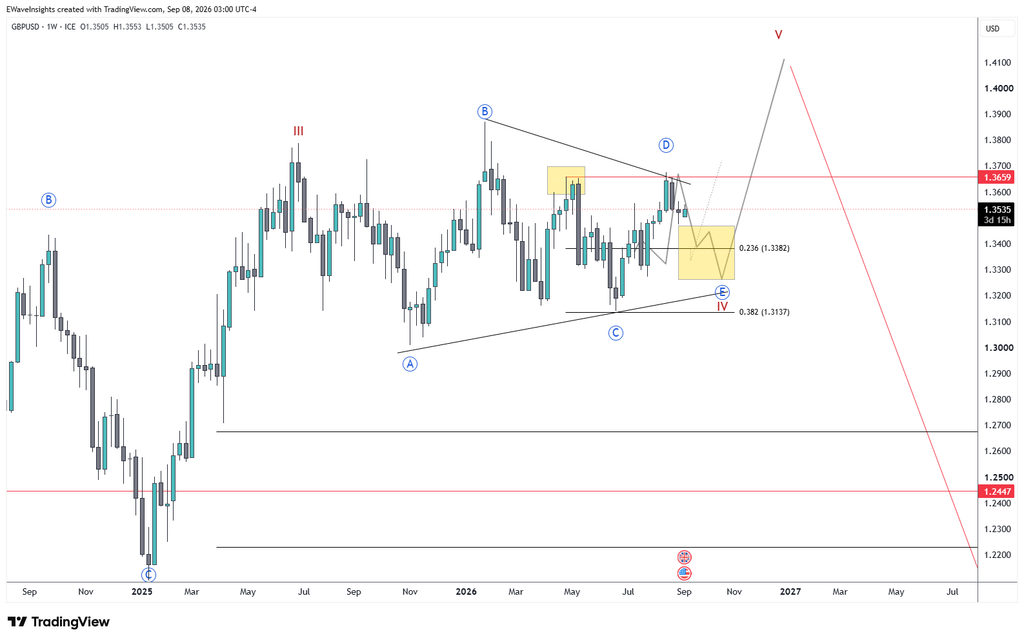
This GBPUSD Elliott Wave analysis tracks the Primary degree triangle on the weekly chart, where wave ((D)) is now complete and price is developing the final leg, wave ((E)), lower before the triangle resolves.
Bias: Bullish (multi-month), pending completion of wave ((E)) Last updated: 8 September 2026
GBPUSD weekly, Elliott Wave Insight. Wave ((D)) complete, wave ((E)) developing inside the triangle.
Why GBPUSD Is a Different Kind of Chart
GBPUSD has been building the same Grand Supercycle degree triangle since 1971, and the current leg, Cycle wave IV, has been forming since June 2025. That’s a long enough timeline that a single snapshot goes stale fast, so this page is kept current as the structure develops rather than written once.
Current GBPUSD Elliott Wave Count
- Grand Supercycle: ((a))-((b))-((c))-((d))-((e)) triangle from 1971
- Supercycle: (a)-(b)-(c) of Grand Supercycle wave ((d)), currently unfolding wave (a)
- Cycle: I-II-III-IV-V from 2022, currently in wave IV, part of Supercycle wave (a)
- Primary: ((A))-((B))-((C))-((D))-((E)) triangle forming Cycle wave IV, started 30 June 2025, with wave ((D)) now complete
- Intermediate/Minor: wave ((E)) developing as a corrective leg lower on the weekly chart
Cycle wave III completed its advance, and the market has spent the time since building out a Primary degree triangle for Cycle wave IV, underway since late June 2025. Triangles unfold in five overlapping legs labelled ((A)) through ((E)), and four of those five legs are now in place. Wave ((E)) is the last piece: a corrective dip that keeps the price action inside the triangle’s boundary lines before the structure resolves. Once Cycle wave IV completes, the next leg higher, Cycle wave V, is expected to complete the larger Supercycle wave (a) within the multi-decade Grand Supercycle triangle, so this triangle is a pause within a much longer-running structure rather than a standalone pattern.
A reliable GBPUSD Elliott Wave count like this one also has to satisfy the standard Fibonacci retracement relationships between its legs, alongside the guideline of alternation, which says wave ((B)) and wave ((D)) in a triangle should look different in shape and depth from each other. Both hold up here: wave ((D)) retraced a smaller portion of wave ((C)) than wave ((B)) did of wave ((A)), which is typical of a contracting triangle and adds confidence to labelling the current dip as wave ((E)) rather than the start of something larger.
Key Levels
| Level | Price | Why It Matters |
|---|---|---|
| Key Resistance | 1.3659 | Upper boundary of the triangle. A weekly close above this would suggest wave ((E)) has already bottomed. |
| Key Support | 1.3382 | 0.236 retracement of the wave ((D)) advance. First area where wave ((E)) could find support. |
| Invalidation | 1.3137 | 0.382 retracement. A sustained break below here would call the current triangle count into question. |
| Next Target | Above 1.3900 | Projected area for the Cycle wave V advance once wave ((E)) and the triangle complete. |
What This GBPUSD Elliott Wave Count Means for Traders
While wave ((E)) is still developing, expect choppy, overlapping price action inside the 1.3137 to 1.3659 range rather than a clean directional move; that overlap is itself a signature of triangle waves. The bigger picture stays bullish: once wave ((E)) completes, the triangle points to a Cycle wave V advance, with the triangle’s width used to project the size of that move. A weekly close back above 1.3659 would be the first sign that wave ((E)) has already found its low.
This is analysis, not personalised financial advice. Trading carries risk of loss and this page should be read alongside your own risk management.
Learn the Method Behind This Count
If terms like “triangle,” “degree,” and “wave ((E))” are new to you, our Elliott Academy breaks down the rules from first principles: start with What Are Elliott Wave Degrees? or go straight to how triangle patterns behave in their final leg. For the underlying theory itself, Investopedia’s overview of Elliott Wave Theory is a solid general reference.
Get the Full Picture
This page reflects the public summary of our GBPUSD Elliott Wave analysis. EWI members get the complete Primary and Intermediate degree breakdown, live price alerts on the key levels above, and daily updates across 30 tracked markets. See Premium →
An ABC correction is the most fundamental corrective structure in Elliott Wave Theory. Whenever a market finishes an impulsive move, whether that’s a small five-wave rally on a 1-hour chart or a multi-year bull run, the market doesn’t simply reverse in a straight line. Instead, it typically retraces in three distinct legs labelled A, B, and C.
Every abc correction pattern falls into one of two main families: the zigzag and the flat correction. Both share the same A-B-C labelling, but their internal structure, Fibonacci targets, and market implications are very different. Understanding which one you’re looking at is essential for anyone using Elliott Wave analysis to time entries, set stop losses, or anticipate where a pullback is likely to end.
In this guide, we’ll break down what an abc correction is, how to tell a zigzag apart from a flat correction, the rules that govern a valid abc correction pattern, how Fibonacci levels help forecast where it will end, and what typically happens in an abc correction after wave 5.
What Is an ABC Correction?
An abc correction is a three-wave corrective structure that moves against the direction of the preceding trend. Ralph Nelson Elliott identified this pattern as the market’s natural way of correcting an impulsive move before the next trending phase begins.
The three legs are:
- Wave A — the initial move against the prior trend.
- Wave B — a partial or deep retracement of wave A, moving back in the direction of the original trend.
- Wave C — the final leg, which completes the correction and is typically followed by trend resumption.
The internal structure of waves A, B, and C is what determines which type of abc correction wave you’re dealing with, and this is where the zigzag and the flat correction diverge sharply.
Zigzag vs Flat Correction: The Two Core ABC Patterns
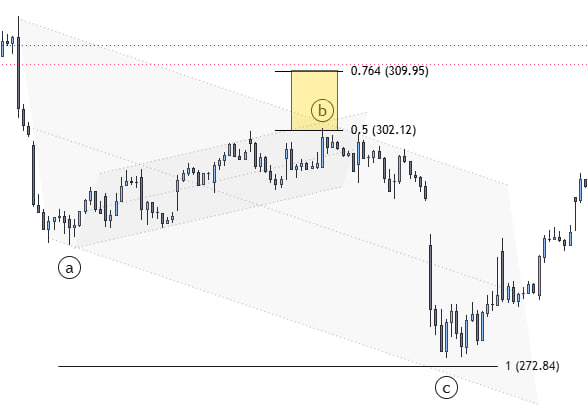
| Feature | Zigzag | Flat Correction |
|---|---|---|
| Wave A structure | 5-wave impulse | 3-wave corrective |
| Wave B retrace | 50–79.6% of Wave A | 90–125%+ of Wave A |
| Wave C structure | 5-wave impulse | 5-wave impulse |
| Overall shape | Sharp, angled “Z” shape | Sideways, range-bound |
| Typical position | Wave 2, 4, or B | Wave 2, 4, B, or X |
| Market signal | Corrective pullback against trend | Strong underlying trend continuing |
For the full breakdown of rules, Fibonacci ratios, trade setups, and real chart examples, see our dedicated guides:
- Zigzag Correction: Rules, Guidelines & Trading Applications
- Flat Correction: Regular, Expanded & Running Patterns
ABC Correction Rules: The Quick Version
Every abc correction pattern, whether zigzag or flat, must satisfy a set of structural rules before it can be labelled with confidence. These abc correction rules are what separate a valid Elliott Wave count from wishful labelling.
- Check Wave A’s internal structure first. Five sub-waves points to a zigzag. Three sub-waves points to a flat.
- Measure Wave B’s retracement of Wave A. A shallow 50–79.6% retrace confirms a zigzag. A deep 90% or greater retrace confirms a flat, and beyond 105% signals an expanded flat.
- Wave C must move in the same direction as Wave A, extending the overall correction rather than reversing it, and should itself be a five-wave impulse in both pattern types.
- An abc correction after wave 5 must fully retrace within the price territory of the prior impulse and cannot be confused with the start of a new impulsive trend in the opposite direction until wave C is complete and confirmed.
- Don’t force a label. If Wave B retraces more than 79.6% but Wave A only shows three waves, you are looking at a flat, not an aggressive zigzag. If Wave A shows five waves but Wave B retraces less than 50%, reassess before assuming a standard zigzag.
ABC Correction Fibonacci Levels
Fibonacci retracement and extension levels are the standard tool for projecting where an abc correction is likely to end, but the abc correction fib levels you should use depend entirely on which pattern type you’ve identified.
Zigzag Fibonacci Targets
- Wave B commonly retraces 50–79.6% of Wave A, with 61.8% the most frequent.
- Wave C often equals the length of Wave A (a 1.0 extension), or extends to 123.6–161.8% of Wave A.
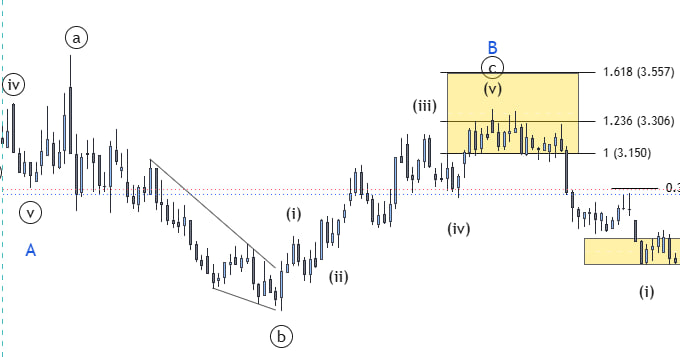
Full detail, including frequency statistics for each ratio and a live XAUUSD example, is covered in our zigzag correction guide.
Flat Correction Fibonacci Targets
- Wave B retraces 90–100% of Wave A in a regular flat, 105–125% in an expanded flat, and beyond 125% in a rare running flat.
- Wave C typically reaches the 1.236–1.618 extension of Wave A, with 1.618 the most common primary target.
Full detail, including all three flat sub-types and a live XAUUSD example, is covered in our flat correction guide.
ABC Correction After Wave 5
One of the most practical applications of this pattern is identifying an abc correction after wave 5. Once a five-wave impulse completes, whether that’s wave 5 of a smaller degree or the final wave of a larger Elliott Wave cycle, the market almost always needs to correct that advance before the next impulsive phase begins.
This is where distinguishing between a zigzag and a flat becomes critical for trade planning:
- If the correction after wave 5 forms as a zigzag, expect a sharp, fast retracement of 50–79.6% before the next impulsive move begins, often signalling the trend is still intact but taking a decisive breather.
- If it forms as a flat, particularly an expanded flat, expect a slower, sideways retracement that retraces deep into Wave A territory before Wave C completes. This pattern is often a sign of a very strong underlying trend that will resume with force once the flat completes.
- Confirming that wave C has completed, ideally with momentum divergence or a clear five-wave sub-structure, gives traders a higher-confidence entry point in the direction of the original trend.
Common Mistakes When Labelling an ABC Correction
- Confusing wave B for the start of a new trend. Because wave B moves in the same direction as the original impulse, it’s tempting to assume the trend has resumed. Always wait for wave C to develop before drawing that conclusion.
- Forcing a zigzag label onto what is actually a flat. If wave A only shows three sub-waves rather than five, the structure is a flat, not a zigzag, and the Fibonacci targets change accordingly.
- Using only the 100% Wave A target for Wave C in a flat. Flat corrections most commonly see Wave C reach 1.618 times Wave A, not just an equal move.
- Ignoring the running flat and truncated zigzag possibilities. Both are less common but signal an unusually strong underlying trend once identified correctly.
Final Thoughts
The abc correction is the building block behind nearly every corrective structure in Elliott Wave Theory, from simple pullbacks to complex double and triple three combinations. Learning to distinguish a zigzag from a flat, applying the correct Fibonacci levels for each, and correctly identifying an abc correction after wave 5 will sharpen your wave counts and improve your timing on both entries and exits.
For the complete rules, Fibonacci tables, identification checklists, and live chart examples, explore our full guides on the zigzag correction and the flat correction, or follow our daily Elliott Wave analysis for updated charts and wave counts as these patterns form in real time across gold, indices, and forex pairs.
More Elliott Wave Education
For more Elliott Wave education, pattern breakdowns and market analysis, visit the Elliott Wave Insight YouTube channel .