
Gold Elliott Wave Analysis Update – November 11, 2025
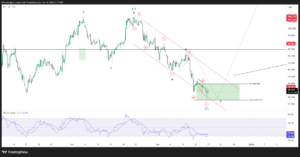
Gold technical analysis reveals that XAU/USD continues to develop an expanding flat corrective pattern (A-B-C formation) on the 4-hour chart. After completing wave (iv), the current Elliott Wave gold price action suggests one more bullish push higher toward key resistance zones before a potential reversal. This gold price forecast is ideal for active futures traders and gold trading enthusiasts.


Current XAU/USD Wave Structure
- Elliott Wave Pattern: Corrective (A-B-C) Expanding Flat Formation
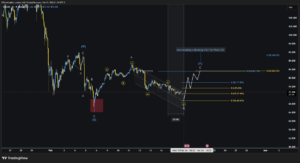
- Current Wave Position: Near completion of wave C, subwave (v)
- Gold Price Level: $4,114.77 (as of Nov 11, 18:09 UTC)
- Price Action Signal: Bullish continuation expected
Gold Resistance Levels – Fibonacci Extension Targets
Key resistance zones for gold trading strategies based on Fibonacci analysis:
- 0.382 Fibonacci Extension: $4,149.23 (First resistance)
- 0.5 Fibonacci Extension: $4,191.79 (Mid-level target)
- 0.618 Fibonacci Extension: $4,238.35 (Primary resistance zone)
- 0.764 Fibonacci Extension: $4,293.48 (Extended target)
The current XAU/USD technical analysis structure indicates that gold futures are approaching the final leg of the corrective wave before a potential deeper retracement. Traders employing Elliott Wave trading strategies should watch for signs of exhaustion or reversal patterns near the highlighted resistance zones.
Gold Trading Strategy – Day Trading and Swing Trading Setup
Short-term XAU/USD Outlook:
- Price Direction: Bullish continuation toward 4194–4238
- Risk Management: Monitor price action near Fibonacci resistance levels
- Stop Loss Level: Invalidation below $4,080 suggests alternate Elliott Wave counts
This gold trading setup is ideal for swing traders and day traders looking to capture the final push in this corrective wave formation. Using NinjaTrader or similar trading platforms, traders can implement tight risk controls and execute quick scalps.
Why Elliott Wave Gold Analysis Matters
Elliott Wave theory provides a structured approach to understanding market cycles and price patterns. For gold traders, recognizing corrective patterns like the expanding flat formation helps identify high-probability reversal zones. This technical analysis method combines well with volume analysis and price action trading for enhanced accuracy.
Gold Market Context
Gold markets have shown strong correlation with economic uncertainty and geopolitical factors. The current XAU/USD forecast reflects broader commodity trading trends and precious metals interest from institutional and retail traders.
Key Takeaways for Gold Traders
- Monitor the 0.618 Fibonacci level ($4,238) for potential reversal signals
- Use Elliott Wave analysis in conjunction with volume indicators for confirmation
- Apply risk management principles with stops below key levels
- Track gold price action near round numbers and Fibonacci levels
Want Next Week’s Elliott Setups First?
Subscribe below to get premium analysis, early trade signals, and the latest strategy updates direct to your inbox.
Get Exclusive Updates
Already a member? Log in here | Free Discord Join our Discord room
Disclaimer
Join the discussion