GBPJPY Elliott Wave Analysis
GBPJPY Elliott Wave analysis has presented a compelling Elliott Wave setup, and our recent analysis predicted a converging triangle pattern that would lead to a significant drop. This post documents our forecast, the price action that followed, and the key lessons for traders using Elliott Wave methodology.
Recent Twitter Posts on GBPJPY
These charts reveal precise Elliott Wave labelling, Fibonacci retracement levels, and critical support/resistance zones across each timeframe.


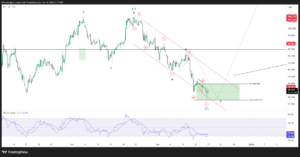
GBPJPY Monthly Chart
Showing the bigger picture for our sell targets
The monthly timeframe Elliott Wave count suggests we are currently trading within a complex triangle structure in wave (E), which is likely to target the 0.618 (192.422) and 0.764 (189.401) Fibonacci levels shown on the chart below. This long-term perspective provides strong conviction in our directional bias and profit targets.

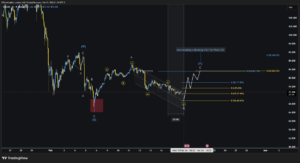
On the 4-hour timeframe, price action has progressed exactly as our Elliott Wave count predicted. Wave (3) is currently driving lower toward the 1.618 extension at 197.339, with a deeper target at the 2.618 extension at 193.670.

#GBPJPY 4H: #TrianglePattern Forming
— Elliott Wave Insights (@EWaveInsights) October 27, 2025
Clear Elliott Wave structure shows a converging triangle pattern developing
as wave (4) correction.
Key Levels:
? Upper Triangle: Wave C 204.06
? Lower Triangle: Wave B 201.93
? Wave (5):Target 200.03#ElliottWave #ForexTrading pic.twitter.com/iHnAen90wX
Want Next Week’s Elliott Setups First?
Subscribe below to get premium analysis, early trade signals, and the latest strategy updates direct to your inbox.
Get Exclusive Updates
Already a member? Log in here | Free Discord Join our Discord room
Disclaimer
Join the discussion