 1")
BTCUSD Elliott Wave Analysis: Cycle Wave IV Triangle Roadmap (Monthly)
This BTCUSD Elliott Wave analysis uses the monthly chart to map Bitcoin as part of a multi‑year impulsive advance, with Cycle Waves 1 and 2 complete and price now deep into a powerful Cycle Wave 3. The video explores the idea that, once Cycle Wave 3 finishes, BTCUSD may transition into a large Cycle Wave 4 triangle consolidation rather than an immediate collapse or straight‑line melt‑up.
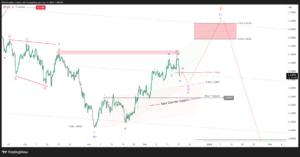
A contracting triangle outline is shown on the right side of the chart, treating the first sharp decline from the peak as Wave A and the current overlapping recovery as Wave B, with the market expected to rotate through A–B–C–D–E before launching Cycle Wave 5 higher.
Key levels and scenarios
- Preferred scenario: BTCUSD Elliott Wave analysis favours Cycle Wave 4 developing as a broad triangle while price holds the 0.382 retracement of the prior advance and the lower boundary of the long‑term channel. Above that cluster, the triangle remains preferred over a full trend reversal.
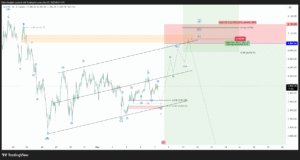
- Bullish outcome: Once Wave E of 4 completes, Elliott Wave guidelines project a strong Cycle Wave 5 thrust, with upside targets from the 1.618 and 2.618 extensions of earlier impulses, pointing to significantly higher prices than today.
- Risk to the roadmap: A decisive monthly close well below channel support and the 0.382 retracement would argue for a deeper flat or more bearish structure, while a straight impulsive break through the proposed B‑wave highs without sideways compression would imply the advance is still part of an ongoing Cycle Wave 3, not a triangle.

Join the discussion