

EURUSD Elliott Wave Analysis: Wave 4 Bounce Before Further Downside
Introduction
EURUSD Elliott Wave Forecast: EURUSD remains within an important larger Elliott Wave structure, with the monthly chart suggesting that a triangle may be developing.
Waves A, B and C appear complete, leaving the possibility that wave D is now unfolding as a double three. Within that larger structure, the first leg, wave W, could be approaching completion.
This creates the potential for a corrective recovery before the next larger leg unfolds.
In the analysis below, I break down the monthly, weekly and daily charts to explain the current Elliott Wave count, the potential wave 4 bounce and the key levels I am watching.
Monthly EURUSD Elliott Wave Structure
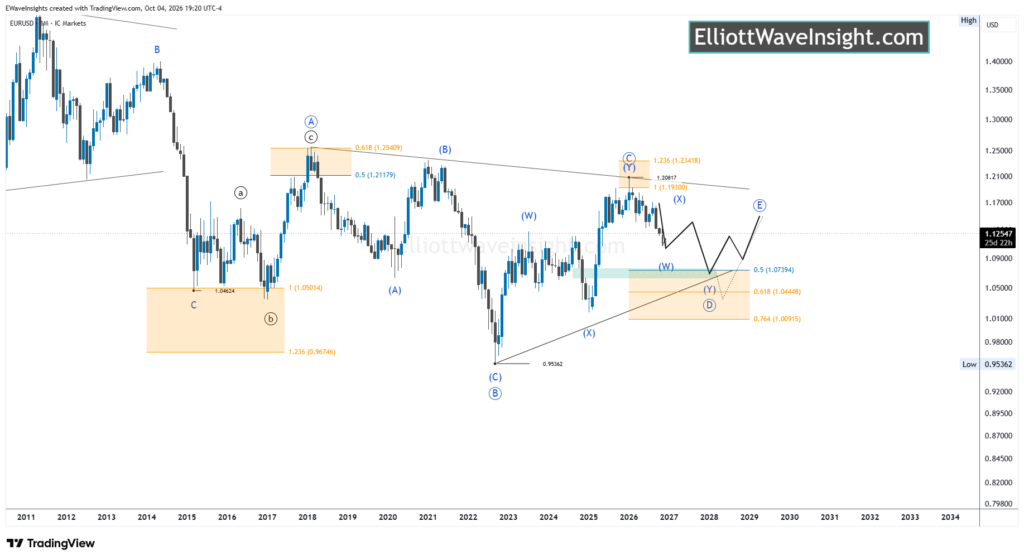
The monthly chart provides the larger framework for the current EURUSD count.
I am interpreting the structure as a triangle, with waves A, B and C appearing complete. Based on this interpretation, wave D may now be developing, with a double-three structure the preferred scenario.
If wave D is unfolding as a double three, its first component, wave W, could be nearing completion.
That would suggest the possibility of a corrective recovery before the next leg of wave D develops.
For now, the focus is on identifying whether the current decline can complete the wave W structure and provide the foundation for a larger corrective move.
Weekly Chart: Wave W Structure
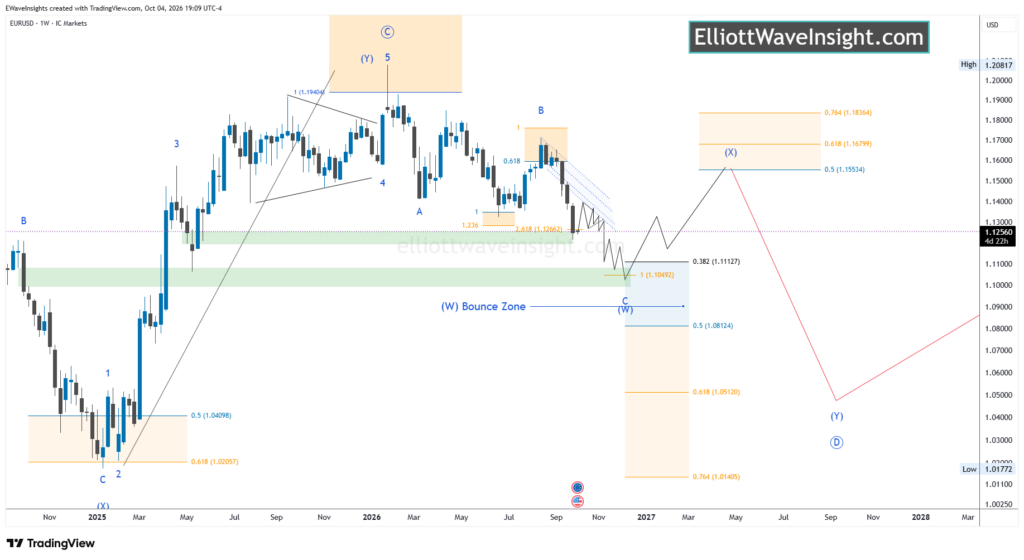
Moving down to the weekly chart gives us a clearer look at the internal structure of wave W.
Wave W appears to be developing as a double-three correction. Within this structure, wave A formed as an impulse, while wave B appears to have completed as a running flat.
The current expectation is for wave C to continue lower.
Within wave C, waves 1 and 2 appear complete, while wave 3 has already reached the 2.618 Fibonacci extension.
From here, I am watching for a wave 4 recovery.
Because wave 2 was a relatively sharp correction, the principle of alternation suggests that wave 4 could develop as a more sideways or complex structure. One possibility is a triangle developing within wave 4.
Wave C Target
The main downside target for wave C is around:
1.1094
This area is significant because of the confluence between the 0.382 Fibonacci retracement and the equal-leg projection of wave A from wave B.
When multiple Fibonacci measurements converge around the same area, it can provide a useful zone to monitor for a potential wave completion.
Once wave W is complete, the larger wave X could then retrace part or all of the wave W decline.
The 0.5–0.764 retracement zone of wave W would therefore become an important area to monitor for a potential wave X recovery.
Daily Chart: Potential Wave 4 Bounce
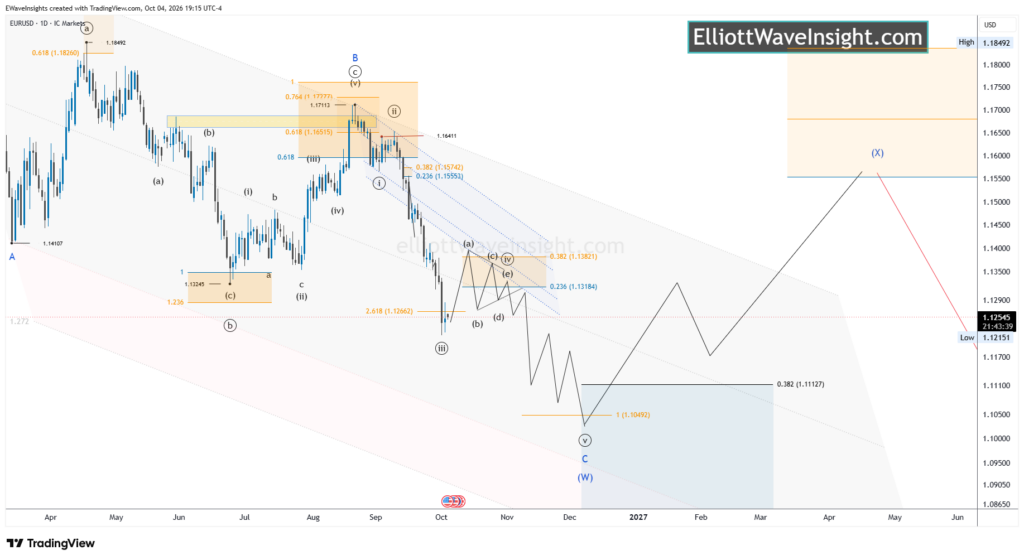
The daily chart allows us to examine the potential wave 4 recovery in greater detail.
Since wave 2 developed as a relatively simple sharp correction, alternation suggests that wave 4 may be more complex and sideways in character.
For this reason, I am watching the:
1.1321–1.1384
area as a potential wave 4 recovery zone.
This corresponds approximately with the 0.236–0.382 Fibonacci retracement area.
A triangle could potentially develop within wave 4 around this region, although the exact structure will need to be confirmed as price action unfolds.
The important point is that a recovery into this area would not necessarily signal the end of the larger bearish structure. Instead, it could represent an intermediate correction within wave C.
Once wave 4 is complete, the larger wave C decline remains expected to continue lower.
Key EURUSD Levels
Potential Wave 4 Recovery:
1.1321–1.1384
Primary Wave C Target:
1.1094
Potential Wave X Retracement:
0.5–0.764 of the Wave W decline
The 1.1094 area is particularly important because of the Fibonacci confluence discussed above.
EURUSD Elliott Wave Forecast: What Happens Next?
The current Elliott Wave interpretation suggests that EURUSD may be approaching an important turning point within the larger structure.
The immediate focus is on whether the decline can complete the current wave W structure and allow wave 4 to develop higher.
The 1.1321–1.1384 area is therefore the key near-term zone I am watching.
If wave 4 develops as expected, potentially as a triangle or another sideways corrective structure, the larger wave C decline toward 1.1094 would remain the main scenario.
Following completion of wave W, attention would then shift toward the potential wave X recovery, where the 0.5–0.764 retracement zone could become significant.
As with all Elliott Wave analysis, the count remains subject to revision as new price action develops.
Follow EURUSD Analysis
For the latest EURUSD wave count, key levels and developing scenarios, visit the EURUSD Market Hub
Elliott Wave Insight also covers other major markets and publishes regular market updates to help traders follow the larger technical picture.