

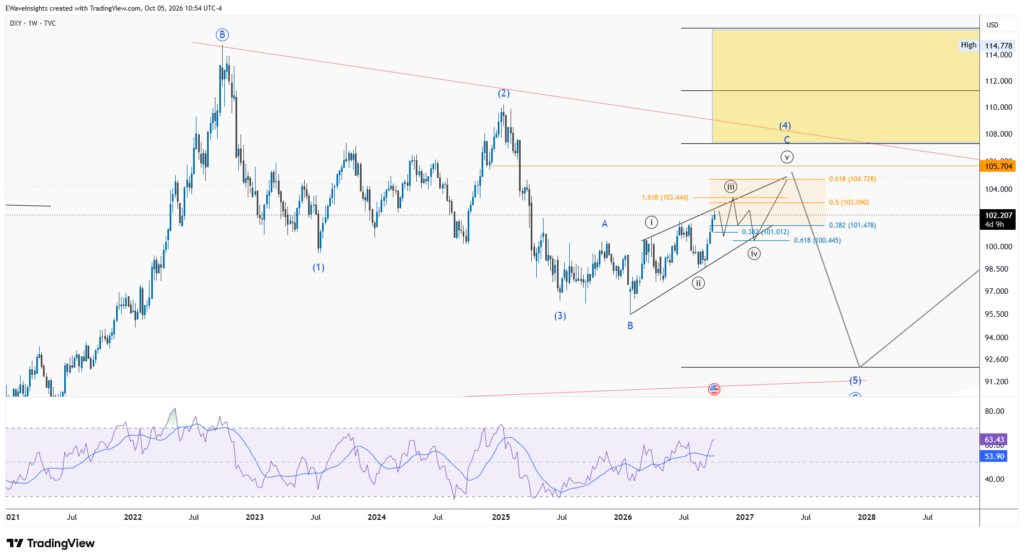
Our DXY Elliott Wave analysis continues to track the US Dollar Index as it develops within the larger corrective structure we’ve been following. The current advance is becoming increasingly interesting, with the internal subdivisions suggesting that wave (C) may be developing as an ending diagonal.
The key question now is whether DXY can continue higher through the current Fibonacci resistance zone, complete wave (iii), and subsequently develop waves (iv) and (v) within the larger structure.
Tracking Wave (C)
Within the proposed ending diagonal, we’re tracking the sequence:
(i) → (ii) → (iii) → (iv) → (v)
The current advance appears to be developing into wave (iii).
Several Fibonacci relationships give us useful reference points for this leg.
The 1.618 extension sits around 103.44, while the 0.50 retracement is around 103.09 and the 0.618 level around 104.73.
This creates an important zone between roughly 103.09 and 104.73 as the current advance develops.
What comes next?
If the current subdivision continues to follow the proposed structure, we could see:
Wave (iii) advance toward the 103.44–104.73 region.
That could then be followed by wave (iv), with the chart currently illustrating a potential retracement toward approximately 100.45.
From there, the final wave (v) could develop higher and potentially take DXY through the 105.70 resistance area.
The larger diagonal, however, could extend beyond 105.70, with the upper boundary of the structure currently sitting considerably higher.
The bigger picture
This is where the setup becomes particularly interesting.
The entire advance is still taking place beneath the major descending trendline originating from the 2022 high.
If the ending-diagonal interpretation is correct, the eventual completion of wave (C) could mark an important turning point in the larger structure.
The longer-term projection shown on the chart currently places the potential completion of the larger decline around 92.11, although that remains a conditional Elliott Wave scenario rather than a fixed target.
Momentum
The weekly RSI is currently around 64, showing that upside momentum has strengthened.
However, RSI has not yet reached the traditional 70 overbought threshold, meaning there is still room for momentum to continue building if the price structure supports it.
This is worth watching alongside the wave count rather than in isolation.
Levels we’re watching
103.09 — 0.50 Fibonacci reference
103.44 — 1.618 extension / potential wave (iii) reference
104.73 — 0.618 Fibonacci reference
105.70 — major resistance / important structural level
~100.45 — potential wave (iv) retracement area
92.11 — longer-term projected wave (C) completion area
Bottom line
DXY is approaching an important part of the structure.
We’re not calling the top yet. Instead, we’re tracking whether price can complete the proposed wave (iii), produce the expected wave (iv) retracement, and then develop the final wave (v) of the larger ending diagonal.
The next few subdivisions should tell us a lot.
For now, 103.44–104.73 is the key upside zone we’re watching, while the reaction from that area will be important in determining whether the proposed ending-diagonal count continues to fit.
Elliott Wave analysis is a working interpretation of market structure. Alternative counts remain possible and the structure can change as new price data develops.
This is general information only and not financial advice. For personal guidance, please talk to a licensed professional.
EURUSD Elliott Wave Analysis: Wave 4 Bounce Before Further Downside
Introduction
EURUSD Elliott Wave Forecast: EURUSD remains within an important larger Elliott Wave structure, with the monthly chart suggesting that a triangle may be developing.
Waves A, B and C appear complete, leaving the possibility that wave D is now unfolding as a double three. Within that larger structure, the first leg, wave W, could be approaching completion.
This creates the potential for a corrective recovery before the next larger leg unfolds.
In the analysis below, I break down the monthly, weekly and daily charts to explain the current Elliott Wave count, the potential wave 4 bounce and the key levels I am watching.
Monthly EURUSD Elliott Wave Structure
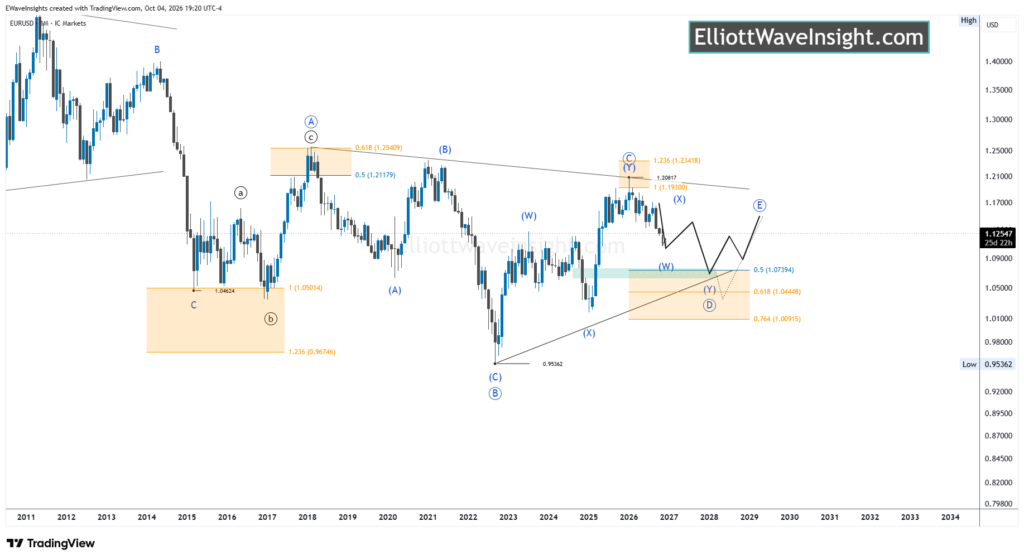
The monthly chart provides the larger framework for the current EURUSD count.
I am interpreting the structure as a triangle, with waves A, B and C appearing complete. Based on this interpretation, wave D may now be developing, with a double-three structure the preferred scenario.
If wave D is unfolding as a double three, its first component, wave W, could be nearing completion.
That would suggest the possibility of a corrective recovery before the next leg of wave D develops.
For now, the focus is on identifying whether the current decline can complete the wave W structure and provide the foundation for a larger corrective move.
Weekly Chart: Wave W Structure
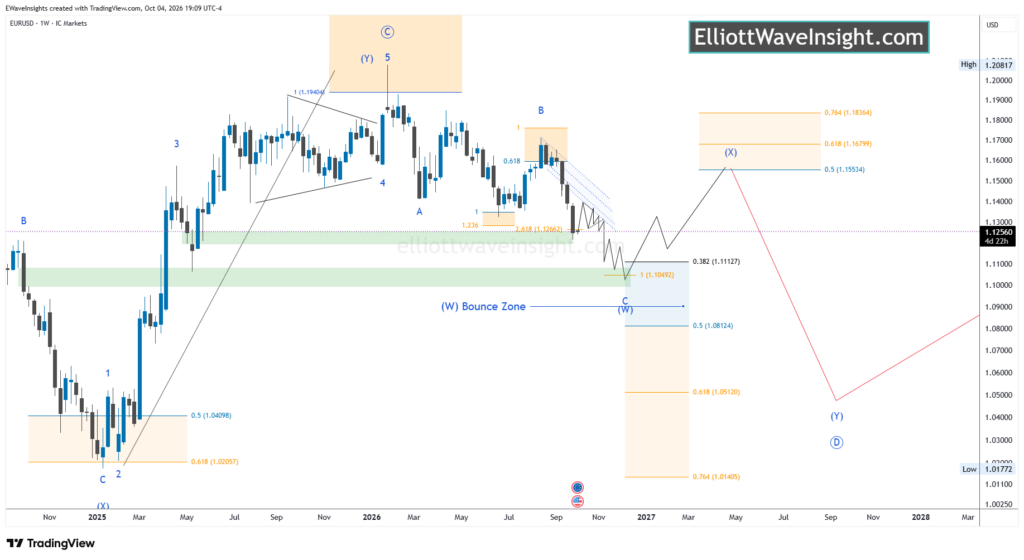
Moving down to the weekly chart gives us a clearer look at the internal structure of wave W.
Wave W appears to be developing as a double-three correction. Within this structure, wave A formed as an impulse, while wave B appears to have completed as a running flat.
The current expectation is for wave C to continue lower.
Within wave C, waves 1 and 2 appear complete, while wave 3 has already reached the 2.618 Fibonacci extension.
From here, I am watching for a wave 4 recovery.
Because wave 2 was a relatively sharp correction, the principle of alternation suggests that wave 4 could develop as a more sideways or complex structure. One possibility is a triangle developing within wave 4.
Wave C Target
The main downside target for wave C is around:
1.1094
This area is significant because of the confluence between the 0.382 Fibonacci retracement and the equal-leg projection of wave A from wave B.
When multiple Fibonacci measurements converge around the same area, it can provide a useful zone to monitor for a potential wave completion.
Once wave W is complete, the larger wave X could then retrace part or all of the wave W decline.
The 0.5–0.764 retracement zone of wave W would therefore become an important area to monitor for a potential wave X recovery.
Daily Chart: Potential Wave 4 Bounce
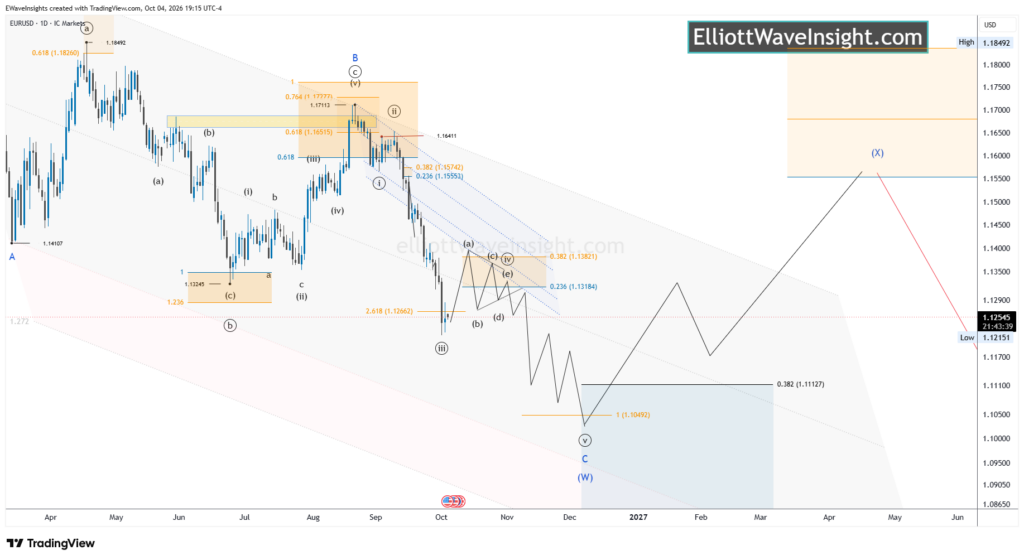
The daily chart allows us to examine the potential wave 4 recovery in greater detail.
Since wave 2 developed as a relatively simple sharp correction, alternation suggests that wave 4 may be more complex and sideways in character.
For this reason, I am watching the:
1.1321–1.1384
area as a potential wave 4 recovery zone.
This corresponds approximately with the 0.236–0.382 Fibonacci retracement area.
A triangle could potentially develop within wave 4 around this region, although the exact structure will need to be confirmed as price action unfolds.
The important point is that a recovery into this area would not necessarily signal the end of the larger bearish structure. Instead, it could represent an intermediate correction within wave C.
Once wave 4 is complete, the larger wave C decline remains expected to continue lower.
Key EURUSD Levels
Potential Wave 4 Recovery:
1.1321–1.1384
Primary Wave C Target:
1.1094
Potential Wave X Retracement:
0.5–0.764 of the Wave W decline
The 1.1094 area is particularly important because of the Fibonacci confluence discussed above.
EURUSD Elliott Wave Forecast: What Happens Next?
The current Elliott Wave interpretation suggests that EURUSD may be approaching an important turning point within the larger structure.
The immediate focus is on whether the decline can complete the current wave W structure and allow wave 4 to develop higher.
The 1.1321–1.1384 area is therefore the key near-term zone I am watching.
If wave 4 develops as expected, potentially as a triangle or another sideways corrective structure, the larger wave C decline toward 1.1094 would remain the main scenario.
Following completion of wave W, attention would then shift toward the potential wave X recovery, where the 0.5–0.764 retracement zone could become significant.
As with all Elliott Wave analysis, the count remains subject to revision as new price action develops.
Follow EURUSD Analysis
For the latest EURUSD wave count, key levels and developing scenarios, visit the EURUSD Market Hub
Elliott Wave Insight also covers other major markets and publishes regular market updates to help traders follow the larger technical picture.
The Most Common Triangle Pattern (~80% of All Triangles)
The Elliott Wave contracting triangle is the textbook version of the pattern, the one most traders picture when they hear “triangle.” It’s also the most frequent, the large majority of triangle formations you will encounter across every market and timeframe.
Contracting Triangle Structure at a Glance
- Position: Wave 4, Wave B, Wave X, or the final leg of a combination, the same positional rule that governs every triangle type
- Subdivisions: 5 waves (A-B-C-D-E), each a 3-wave structure (3-3-3-3-3)
- Shape: Both trendlines converge symmetrically toward an apex
- Rule: Each wave contracts against the last one travelling in the same direction, so C is shorter than A, E is shorter than C, and D is shorter than B
- Thrust: Equal to the widest part of the pattern, the height of Wave A
See a live example of this structure below.
Why the Progressive Shrinking Matters
A contracting triangle is defined by steadily decreasing amplitude. Wave B doesn’t travel as far as wave A did, wave C falls short of wave B, wave D falls short of wave C, and wave E, the final leg, is the smallest swing of all. That steady contraction pulls both trendlines toward a single point, the apex, and makes the pattern easy to spot once you know to look for it, each swing visibly tightens compared to the last.
A Real Chart Example: Wave (B) Contracting Triangle
The chart below shows a genuine contracting triangle unfolding in the wave (B) position, forming after the wave (III) decline and resolving into wave (IV). Inside wave (B), the five legs, A, B, C, D, and E, each subdivide into three-wave structures, exactly as the rule requires.
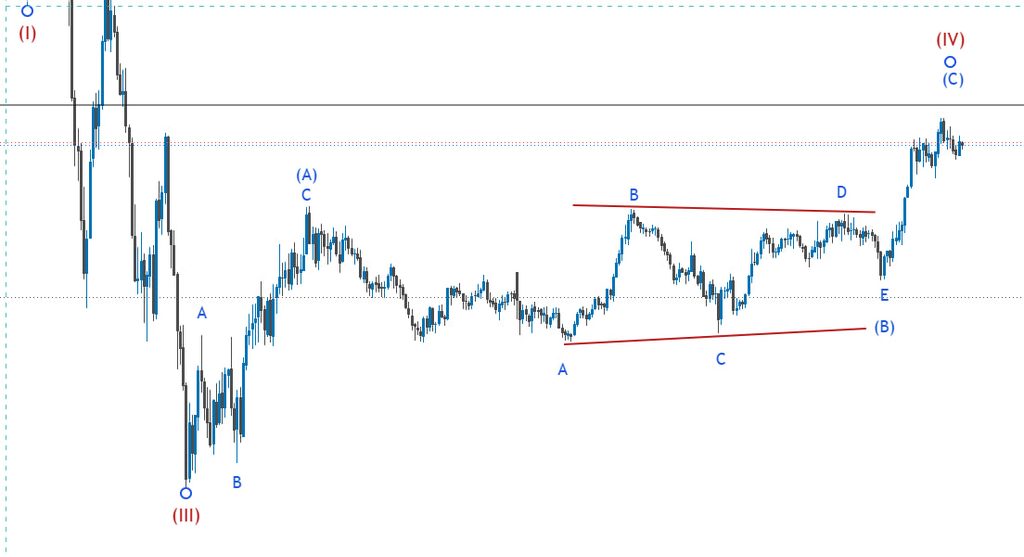
Both trendlines converge as the pattern develops: the upper line connects the highs of B and D, while the lower line connects the lows of A and C, with wave E finally touching that lower trendline before the pattern completes. Each leg is visibly smaller than the one before it, wave B doesn’t reach as high as the move into (A) did, and by the time wave E forms, the price range has contracted to its narrowest point in the whole structure. Once E completes, price breaks decisively higher, exactly the kind of thrust the pattern is known for.
Contracting Triangle Fibonacci Ratios
Beyond the basic shrinking rule, contracting triangles tend to respect specific Fibonacci retracement ranges between waves:
- Wave B typically retraces 61.8% to 78.6% of wave A
- Wave C typically retraces 61.8% to 78.6% of wave B
- Wave D typically retraces 61.8% to 78.6% of wave C
- Wave E typically retraces 61.8% to 78.6% of wave D, and often overshoots or falls short of the trendline before finally reversing
These ratios aren’t strict requirements, but seeing them line up adds confidence that the sideways move is a genuine triangle rather than a random consolidation.
The Payoff: Trading the Thrust
Once wave E completes near the apex, price doesn’t usually resume the prior trend gradually, it thrusts. That’s the defining behavior traders wait for, a swift, often sharp move in the direction of the larger trend, with a minimum target equal to the width of wave A projected from wave E’s completion.
How to Trade a Contracting Triangle
Two standard approaches apply:
- Trade the thrust after Wave E: enter on a decisive break of wave D’s extreme once wave E completes, targeting 100% of wave A’s height, with a stop just beyond wave E’s high or low
- Fade Wave E at the trendline: enter as wave E touches the A-C trendline, anticipating the move back toward the B-D line before the real thrust begins
Contracting Triangle vs. Expanding Triangle
It’s worth noting the contracting triangle’s defining feature, each wave shrinking relative to the last, is the opposite of its far rarer cousin, the expanding triangle, where each wave grows larger than the one before it. If a triangle appears to be widening rather than narrowing as it develops, it likely isn’t a contracting triangle at all, and the shrinking-wave rule outlined above won’t apply.
Common Mistakes to Avoid
- Labeling a triangle in Wave 2 or Wave A, triangles only occur in Wave 4, B, X, or as the closing leg of a combination
- Treating any 5-wave sub-swing as part of the triangle, all five legs must be 3-wave structures
- Waiting for wave E to touch the trendline before acting, it often falls short and reverses early
- Setting a thrust target that’s too conservative, use the full width of wave A as the minimum
- Ignoring the common wave E overshoot, leave a buffer on stops
Contracting Triangle Quick Reference
- Type: Contracting (Standard)
- Frequency: ~80%, the most common triangle type
- Key tell: Each wave is shorter than the last wave going the same way, C shorter than A, E shorter than C, D shorter than B
- Thrust target: 100% of Wave A’s height, projected from Wave E’s completion
- Where it appears: Wave 4, B, X, or the final leg of a combination, never Wave 2 or A
⚠ Educational content for learning Elliott Wave principles only. Not financial advice.