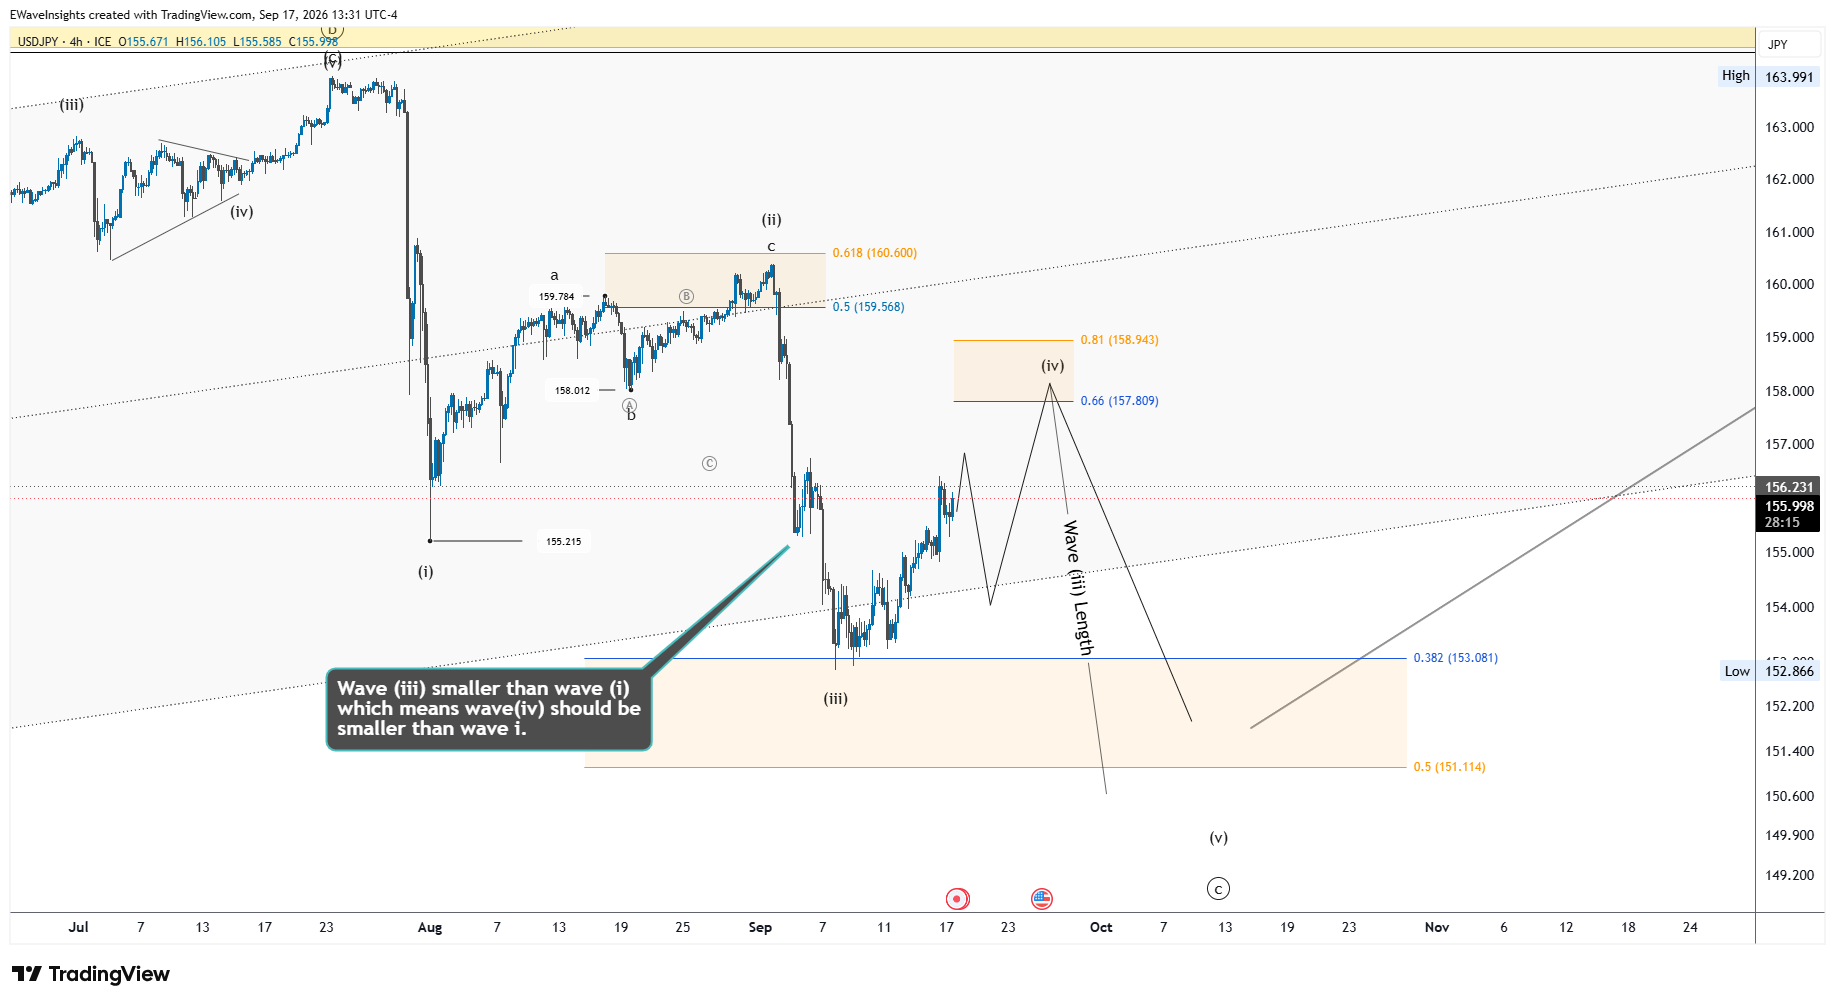
USD/JPY 4H Elliott Wave Analysis
USDJPY 4H Wave (iv) can be more complex than a simple a-b-c. Wave (ii) took form of zigzag and topped at 160.398, wave (iv) is now unfolding expected to pull back into the 157.815 to 158.943 zone before the final push lower to complete wave (v)-((c)) of Minor wave 4 which should complete in the 151.113 to 153.078 zone.
Bias
BullishCurrent wave
Wave 4 Minor degreeCondition
Corrective Near CompleteConfidence
Medium Count activeInvalidation
160.478 Count is wrong beyondElliott Wave analysis is a technical analysis method that identifies repeating price patterns, or "waves," shaped by shifts in investor psychology. It's used to forecast probable future price direction based on the market's current wave structure.
No. Elliott Wave analysis identifies the most probable wave count and price scenario based on current market structure, but markets can and do invalidate a count. It should be used alongside proper risk management, not as a standalone guarantee.
An impulse wave is a five-wave structure that moves in the direction of the larger trend, while a corrective wave is a counter-trend structure (commonly three waves) that retraces part of the prior move.
As of this analysis, USD/JPY is trading in Wave 4, of Minor degree, on the 4h timeframe.
Based on the current Elliott Wave structure, our analysis shows a Bullish bias for USD/JPY.
Sign in to join the discussion.
Sign In to CommentThis analysis is for information and education only and is not financial advice. Trading leveraged products such as forex, futures and CFDs carries a high risk of loss and may not be suitable for all investors. Past performance is not a guide to future results.
You cannot copy content of this page