

At a Glance
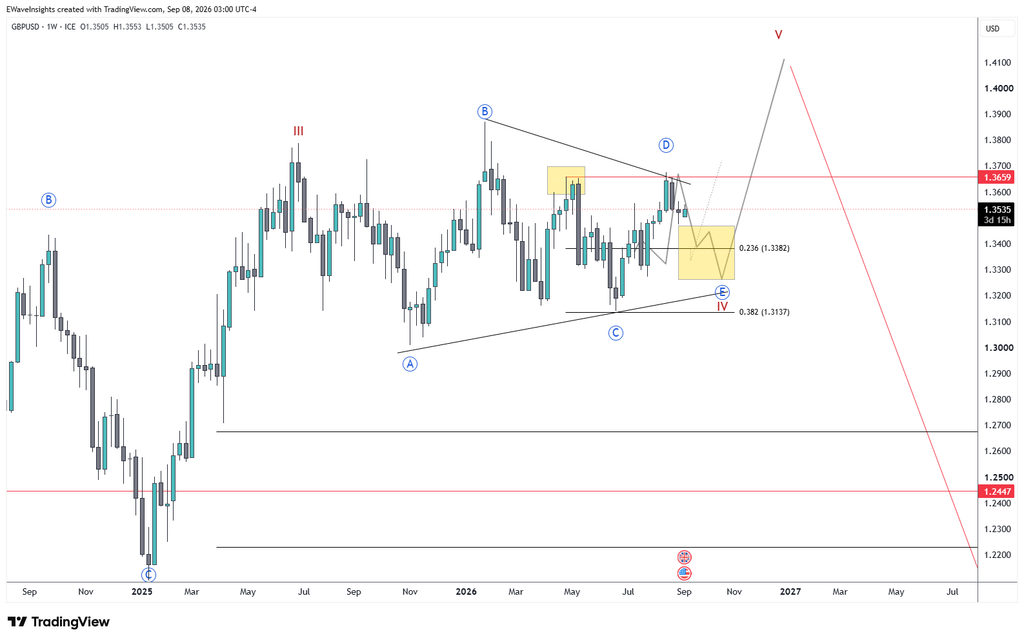
This GBPUSD Elliott Wave analysis tracks the Primary degree triangle on the weekly chart, where wave ((D)) is now complete and price is developing the final leg, wave ((E)), lower before the triangle resolves.
Bias: Bullish (multi-month), pending completion of wave ((E)) Last updated: 8 September 2026
GBPUSD weekly, Elliott Wave Insight. Wave ((D)) complete, wave ((E)) developing inside the triangle.
Why GBPUSD Is a Different Kind of Chart
GBPUSD has been building the same Grand Supercycle degree triangle since 1971, and the current leg, Cycle wave IV, has been forming since June 2025. That’s a long enough timeline that a single snapshot goes stale fast, so this page is kept current as the structure develops rather than written once.
Current GBPUSD Elliott Wave Count
- Grand Supercycle: ((a))-((b))-((c))-((d))-((e)) triangle from 1971
- Supercycle: (a)-(b)-(c) of Grand Supercycle wave ((d)), currently unfolding wave (a)
- Cycle: I-II-III-IV-V from 2022, currently in wave IV, part of Supercycle wave (a)
- Primary: ((A))-((B))-((C))-((D))-((E)) triangle forming Cycle wave IV, started 30 June 2025, with wave ((D)) now complete
- Intermediate/Minor: wave ((E)) developing as a corrective leg lower on the weekly chart
Cycle wave III completed its advance, and the market has spent the time since building out a Primary degree triangle for Cycle wave IV, underway since late June 2025. Triangles unfold in five overlapping legs labelled ((A)) through ((E)), and four of those five legs are now in place. Wave ((E)) is the last piece: a corrective dip that keeps the price action inside the triangle’s boundary lines before the structure resolves. Once Cycle wave IV completes, the next leg higher, Cycle wave V, is expected to complete the larger Supercycle wave (a) within the multi-decade Grand Supercycle triangle, so this triangle is a pause within a much longer-running structure rather than a standalone pattern.
A reliable GBPUSD Elliott Wave count like this one also has to satisfy the standard Fibonacci retracement relationships between its legs, alongside the guideline of alternation, which says wave ((B)) and wave ((D)) in a triangle should look different in shape and depth from each other. Both hold up here: wave ((D)) retraced a smaller portion of wave ((C)) than wave ((B)) did of wave ((A)), which is typical of a contracting triangle and adds confidence to labelling the current dip as wave ((E)) rather than the start of something larger.
Key Levels
| Level | Price | Why It Matters |
|---|---|---|
| Key Resistance | 1.3659 | Upper boundary of the triangle. A weekly close above this would suggest wave ((E)) has already bottomed. |
| Key Support | 1.3382 | 0.236 retracement of the wave ((D)) advance. First area where wave ((E)) could find support. |
| Invalidation | 1.3137 | 0.382 retracement. A sustained break below here would call the current triangle count into question. |
| Next Target | Above 1.3900 | Projected area for the Cycle wave V advance once wave ((E)) and the triangle complete. |
What This GBPUSD Elliott Wave Count Means for Traders
While wave ((E)) is still developing, expect choppy, overlapping price action inside the 1.3137 to 1.3659 range rather than a clean directional move; that overlap is itself a signature of triangle waves. The bigger picture stays bullish: once wave ((E)) completes, the triangle points to a Cycle wave V advance, with the triangle’s width used to project the size of that move. A weekly close back above 1.3659 would be the first sign that wave ((E)) has already found its low.
This is analysis, not personalised financial advice. Trading carries risk of loss and this page should be read alongside your own risk management.
Learn the Method Behind This Count
If terms like “triangle,” “degree,” and “wave ((E))” are new to you, our Elliott Academy breaks down the rules from first principles: start with What Are Elliott Wave Degrees? or go straight to how triangle patterns behave in their final leg. For the underlying theory itself, Investopedia’s overview of Elliott Wave Theory is a solid general reference.
Get the Full Picture
This page reflects the public summary of our GBPUSD Elliott Wave analysis. EWI members get the complete Primary and Intermediate degree breakdown, live price alerts on the key levels above, and daily updates across 30 tracked markets. See Premium →
GBPUSD Elliott Wave Analysis continues to favour a bullish higher‑timeframe roadmap, with price currently working through what looks like a higher‑degree Wave 2 correction after the impulsive advance from the 1.21 area into the 1.37s. The decline from the Wave 1 high into 1.3145 forms the first leg of the correction (w), followed by an overlapping recovery into 1.3725 as x, and price now appears to be developing the final zigzag down in y toward the 1.29–1.28 support region highlighted on the chart.

Key Levels
The primary Wave‑2 downside zone spans from roughly 1.2930, which aligns with the 0.5 retracement of the prior advance, down to around 1.2740, where the 0.618 retracement comes in. The 1.29 handle sits in the middle of this cluster and also coincides with a 1.618 Fibonacci projection of the earlier swing, creating a strong confluence area for a corrective low. As long as GBPUSD holds above the wider 1.2660–1.27 region, the larger impulsive structure from 1.21 remains intact and this correction is still best viewed as Wave 2 rather than the start of a more bearish sequence.
Elliott Wave Roadmap
The preferred roadmap is for price to fade lower from the current descending channel resistance (blue trendline) and complete Wave 2 inside the 1.29–1.28 support box before a fresh Wave 3 advance has room to develop. While that zone has not yet been tested, pops within the channel are treated as corrective rallies, not yet the beginning of Wave 3. Once the boxed area is tagged and defended ideally with evidence of impulsive buying and improving momentum the focus shifts to confirming that Wave 3 is underway, with higher‑timeframe targets then projected using standard Fibonacci extensions of Wave 1.