

Flat Correction
Regular · Expanded · Running · Rules, Fibonacci Extensions & Applications in Analysis
An Elliott Wave flat correction is a sideways corrective pattern consisting of three waves (A-B-C) where Wave B retraces deeply into Wave A territory (90% to 110%+). Unlike the sharp directional zigzag, flats are characterised by consolidation. The market moves sideways before resuming the trend. Wave B’s deep retrace catches many analysts off guard, and Wave C’s Fibonacci extension provides the primary target zone.
What is an Elliott Wave Flat Correction?
A flat correction is a sideways Elliott Wave corrective pattern consisting of three waves (A-B-C) where Wave B retraces deeply into Wave A territory (90% to 110%+). Unlike the sharp directional zigzag, flats are characterised by consolidation. The market moves sideways before resuming the trend. Wave B’s deep retrace catches many analysts off guard, and Wave C’s Fibonacci extension provides the primary target zone. Every Elliott Wave flat correction subdivides 3-3-5. For a wider overview of the theory, see the Elliott wave principle on Wikipedia.
Flat Structure: A-B-C Breakdown
| Wave | Structure | Direction | Characteristic |
|---|---|---|---|
| Wave A | 3-wave sideways pattern | Against trend | Initial correction, establishes the correction support level |
| Wave B | 3-wave deep retracement | Against Wave A | Retraces 90 to 110%+ of Wave A, signals strong underlying trend |
| Wave C | 5-wave impulse | Same as Wave A | Extends 1.236 to 1.618× Wave A, confirms flat completion |
How Can I Tell if a Correction Is a Flat or a Zigzag?
The fastest way to tell them apart is Wave B's retracement of Wave A. In a flat, Wave B retraces 90% or more of Wave A, often exceeding it entirely in an expanded flat. In a zigzag, Wave B only retraces 50% to 78.6% of Wave A, leaving clear unretraced territory. A second check: Wave A's own internal structure is a 3-wave corrective move in a flat, but a 5-wave impulse in a zigzag. If Wave B ends well short of Wave A's start, you're looking at a zigzag; if it comes close to or exceeds it, you're looking at a flat.
Three Types of Flat Corrections
1. Regular Flat (Conservative)
Wave B: Retraces 90 to 100% of Wave A
Wave C: Ends near Wave A start, typically 1.000 to 1.236× Wave A
✓ Lower volatility · ✓ Clear support/resistance · ✓ Moderate trend continuation
2. Expanded Flat (Most Common)
Wave B: Exceeds Wave A start (105 to 125%), breaks prior support
Wave C: Extends 1.236 to 1.618× Wave A, most reliable target zone
✓ Higher volatility · ✓ Breaks support · ✓ Strong trend continuation signal
3. Running Flat (Rare)
Wave B: Far exceeds Wave A (>125%), extreme deep retrace
Wave C: Fails to reach Wave A end, 0.618 to 1.000× Wave A only
⚠ Extremely strong trend · ⚠ Minimal correction before move resumes
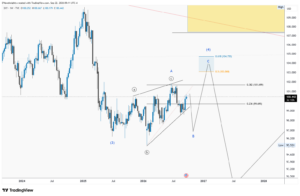
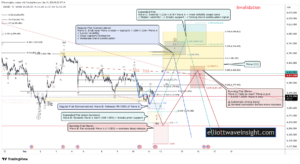
Real examples from EWI's counts
Finished flat structures from our house count, measured from the recorded prices.
Official Flat Correction Rules
Rule 1: Wave A Structure
✓ Wave A MUST be a 3-wave corrective structure
✓ This distinguishes a flat from a zigzag (which has a 5-wave Wave A)
✗ Wave A CANNOT be a 5-wave impulse in a flat correction
Rule 2: Wave B Deep Retrace
✓ Wave B MUST retrace at least 90% of Wave A
✓ Expanded flat: Wave B exceeds Wave A origin (105 to 125%+)
✗ Wave B retracing less than 90% = likely a zigzag, not a flat
Rule 3: Wave C Structure
✓ Wave C MUST be a 5-wave impulse
✓ Reaches 1.236 to 1.618× Wave A in most cases
✗ In a running flat only: Wave C can fail to reach Wave A end
Rule 4: Position in Larger Structure
✓ Flats appear in Wave 2, Wave 4, Wave B, or Wave X positions
✓ Expanded flat in Wave 2 or 4 signals a very strong trend
✓ After Wave C completes, expect a sharp trend resumption impulse
Fibonacci Relationships
Wave B Retracement of Wave A
| Flat Type | Wave B Retraces | Ratio | Market Signal |
|---|---|---|---|
| Regular Flat | 90 to 100% of Wave A | 0.90 to 1.00 | Conservative consolidation |
| Expanded Flat | 105 to 125% of Wave A | 1.05 to 1.25 | Strong trend continuation signal |
| Running Flat | >125% of Wave A | >1.25 | Extremely strong underlying trend |
Wave C Extension of Wave A
| Fibonacci Level | Wave C Target | Frequency | Notes |
|---|---|---|---|
| 0.618× Wave A | Shallow target | 5% | Rare, running flat only |
| 1.000× Wave A | Equal waves | 15% | Regular flat primary target |
| 1.236× Wave A | Common target | 25% | Expanded flat first target |
| 1.382× Wave A | Moderate target | 20% | Between primary levels |
| 1.618× Wave A | PRIMARY TARGET | 30% | Most common, target this first |
| 2.000× Wave A | Extended target | 5% | Rare, very deep correction |
Advanced Fibonacci Guidelines
Wave C = Wave A × Fibonacci (0.618 to 2.000)
The most reliable guideline, Wave C typically equals one of these ratios of Wave A length.
Primary targets: 1.236 and 1.618 of Wave A.
Time Relationship: Wave C Duration ≈ Wave A Duration
Less precise than Fibonacci price ratios, but waves often take similar time to unfold.
Use for confirmation only, not a primary rule.
Flat vs Zigzag: Key Differences
| Aspect | Flat Correction | Zigzag Correction |
|---|---|---|
| Wave A structure | 3-wave corrective | 5-wave impulse |
| Wave B retrace | 90 to 125%+ of Wave A (deep) | 50 to 78.6% of Wave A (shallow) |
| Wave C target | 1.236 to 1.618× Wave A | 100 to 123.6% of Wave A |
| Overall shape | Sideways, range-bound | Sharp directional, steep angle |
| Volatility | Moderate, consolidation | High, sharp reversal |
| Market signal | Strong trend will continue | Corrective pullback against trend |
Applying Flats in Analysis
Outline 1: Wave C From Wave B Completion
After Wave B completes in the 90% to 125% retrace zone, the next move would favour Wave C toward the 1.618 extension of Wave A.
| Wave B complete | Wave B completes at 90% to 125% of Wave A, price stalls and reverses |
| Confirmation | First confirmed reversal candle after the Wave B extreme |
| Target 1 | 1.236× Wave A from Wave B end |
| Target 2 | 1.618× Wave A from Wave B end (primary) |
| Invalidation | Count invalid beyond the Wave B extreme |
Outline 2: Trend Resumption After Wave C
After Wave C completes at the 1.618 extension, the count would favour the powerful trend resumption impulse that follows.
| Confirmation | Wave C reaches 1.618× Wave A with momentum divergence |
| Confirmed by | A break above the Wave B high (bull) or below the Wave B low (bear) |
| Target | Wave 1 start of new impulse, prior swing high/low |
| Invalidation | Count invalid below the Wave C low (above it in a bearish case) |
Flat Correction Identification Checklist
- Does Wave A have a 3-wave corrective structure (NOT 5 waves)?
- Does Wave B retrace at least 90% of Wave A?
- Is Wave B a 3-wave corrective structure?
- Does Wave C have a 5-wave impulse structure?
- For expanded flat: does Wave B exceed Wave A origin?
- Does Wave C reach the 1.236 to 1.618 extension of Wave A?
- Is the pattern in Wave 2, 4, B, or X position of the larger count?
- After Wave C, is there a sharp reversal confirming trend resumption?
- Is the overall shape sideways / range-bound (not a sharp decline)?
Common Flat Correction Mistakes to Avoid
✗ Mistake 1: Confusing a flat with a zigzag because both have 3 waves.
✓ Fix: Check Wave A structure. Flat = 3-wave A. Zigzag = 5-wave A. Also check Wave B depth, flat Wave B retraces 90%+.
✗ Mistake 2: Treating Wave B as a trend reversal.
✓ Fix: Wave B in a flat retraces deeply but is ALWAYS a 3-wave structure. A 5-wave break of Wave A origin = new trend, not Wave B.
✗ Mistake 3: Using only 100% of Wave A as the Wave C target.
✓ Fix: Flat Wave C most commonly reaches 1.618× Wave A. Always set targets at 1.236, 1.382, and 1.618 levels, not just 1.000.
✗ Mistake 4: Labelling Wave C too early, before Wave B completes.
✓ Fix: Wait for Wave B to reach the 90% to 125% zone and show a clear reversal signal before counting Wave C as under way.
✗ Mistake 5: Ignoring the running flat possibility.
✓ Fix: If Wave B exceeds 125% of Wave A and Wave C is very short, it may be a running flat, signals an extremely strong trend resumption ahead.
Real Example: XAUUSD Expanded Flat (Wave 4)
Gold completes Wave 3 impulse at 3,200, then enters a Wave 4 expanded flat correction.
| Wave | Structure | Price Level | Fib Notes |
|---|---|---|---|
| Wave A | 3-wave down | 3,200 → 3,050 (150 pts) | Initial correction |
| Wave B | 3-wave up | 3,050 → 3,215 (165 pts) | 110.0% of Wave A, expanded ✓ |
| Wave C | 5-wave impulse down | 3,215 → 2,972 (243 pts) | 162.0% of Wave A ✓ |
Analysis Outline: Wave C From Wave B Completion
1. Wave B complete at 110% of Wave A, with a reversal from 3,210 favouring Wave C lower
2. Target 1: 3,215 − 185 = 3,030 (1.236× Wave A)
3. Target 2: 3,215 − 243 = 2,972 (1.618× Wave A, primary)
4. Count invalid above 3,230 (above the Wave B high)
Quick Reference: Flat Correction Essentials
- Structure: A (3 waves) → B (3 waves, 90 to 125%+ of A) → C (5 waves, 1.236 to 1.618× A)
- Types: Regular (90 to 100% B) · Expanded (105 to 125% B, most common) · Running (>125% B)
- Key Fib: Wave C = 1.618× Wave A (primary) | 1.236× Wave A (first target)
- Key Rule: Wave A MUST be 3 waves. Wave B MUST retrace 90%+. Wave C MUST be 5 waves.
- vs Zigzag: Flat has 3-wave A and 90%+ Wave B. Zigzag has 5-wave A and 50 to 78.6% Wave B.
- Best Read: Wave C from Wave B completion, target 1.618× Wave A extension